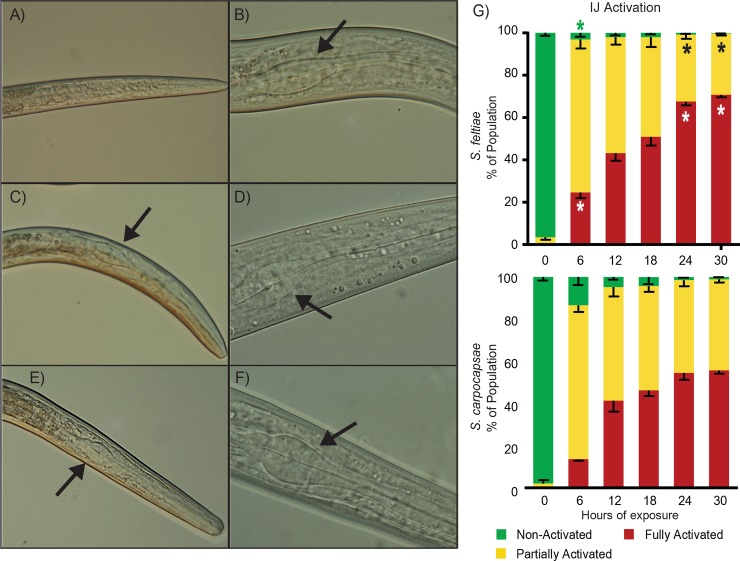
Fig 1. Activation of S. feltiae IJs.
The left panel images are representative images of the head region of S. feltiae IJs exhibiting (A) naïve, (C) partially activated, and (E) fully activated morphology (400x). The pharyngeal bulb, if observable, is indicated by a black arrow. The right panel images are 1000x representative images of the S. feltiae IJs exhibiting activation morphology corresponding to the left panel images with (B) naïve, (D) partially activated, and (F) fully activated. (G) Time course activation rates based on activation morphology of IJs exposed to insect homogenate for 0, 6, 12, 18, 24, and 30 hours. All activation rate data was taken from IJs observed under 400x. The top graph is of S. feltiae activation and bottom graph is of S. carpocapsae activation (S. carpocapsae activation was reproduced from Lu. et al, 2017 with the addition of a 0-hour time point). Stars in the columns of the S. feltiae activation graph indicates a significant difference with p<0.05 between S. feltiae and S. carpocapsae rates of the same category (e.g. S. feltiae 6 hr full activation compared to S. carpocapsae 6 hr full activation, data in S1 Table). Column bars represent the mean with error bars representing standard deviation. Statistical analysis was done using a repeated measures two-way ANOVA with Sidak’s multiple comparisons test.

