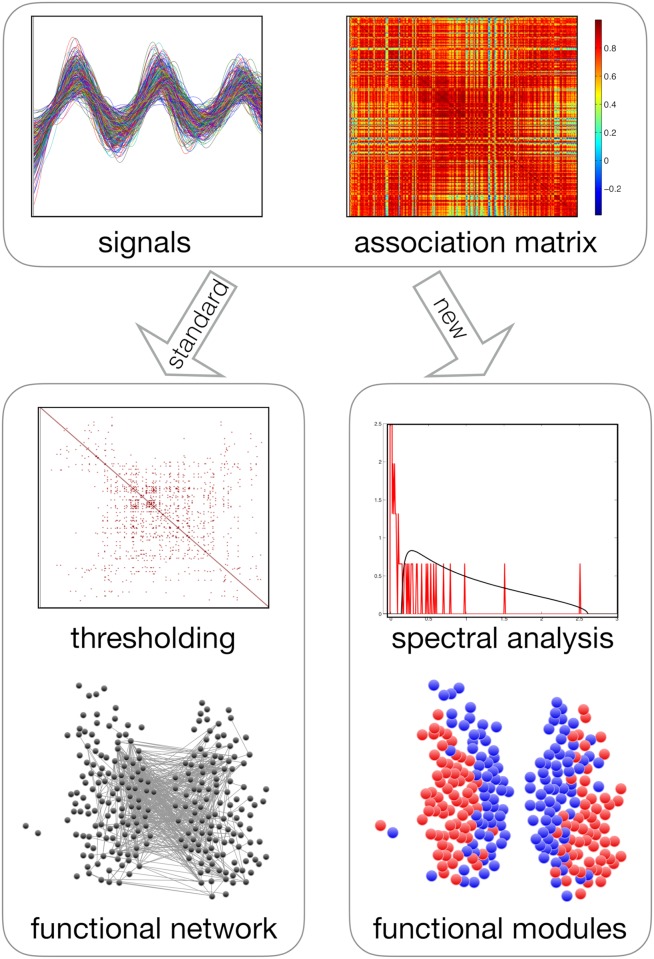
Fig 1. Illustration of the procedure of functional module identification from time series data (top) in the standard approach (bottom left) and in our method (bottom right).
In this example (our empirical data), we can see that the signals share a very strong common periodic trend, which results in very high correlation values. In the standard approach, an arbitrary threshold is defined and the original matrix is projected onto a functional network. This comes at the price of discarding the majority of the data, most notably the negative correlations, and makes the output threshold-dependent. Moreover, modules are searched for in the projected network using null models that are valid for graphs with independent edges, but not for correlation matrices. We should note that there are recent approaches, which will be discussed in the next section, that do not discard negative correlation. In our method, we compare the empirical correlation spectrum against a null model specifically tailored for correlation matrices. This produces a filtered correlation matrix that is subsequently searched for modules. These modules are guaranteed to be statistically significant, noise-free, overall positively correlated internally and overall negatively correlated across. By directly producing a partition of the original time series into modules, our method bypasses the functional network projection, avoiding the use of a threshold.

