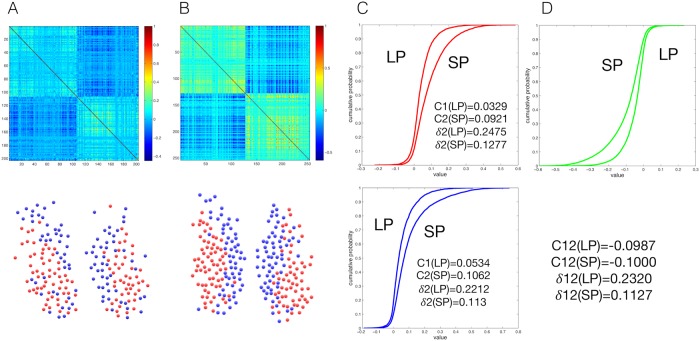
Fig 7.
(A) The resolved functional signature and modules structure of a long photoperiod (LP, L16D8) sample. (B) The resolved functional signature and modules structure of a short photoperiod (SP, L8D16). (C) Cluster analysis: plotting the cumulative distribution of the dependencies within the two detected clusters, comparing the two different photoperiods. The upper graph shows cluster 1 and the lower graph cluster 2. C represents the measured averaged correlation of a cluster, and is defined as the contrast ratio of a cluster, measuring the ratio of negative dependencies versus positive dependencies. (D) Inter-cluster analysis: plotting the cumulative distribution of the external dependencies between the two detected clusters, comparing the two different photoperiods. C represents the measured averaged anti-correlation between clusters, and is defined as the contrast ratio of a cluster, measuring the ratio of positive dependencies versus negative dependencies.

