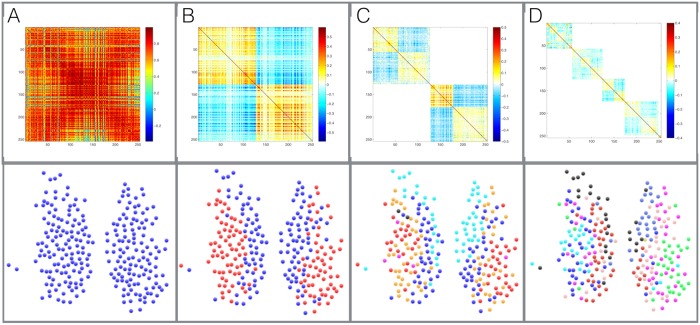
Fig 9. The hierarchical community structure of the SCN as resolved by our method.
The community structure detected by different recursive runs of the method (A,B,C,D). In the bottom panels are the partitions detected, where each community is marked with a different colour. In the top panels are the corresponding resolved filtered correlation matrices (for each run) displaying the resolved structure as a block matrix.

