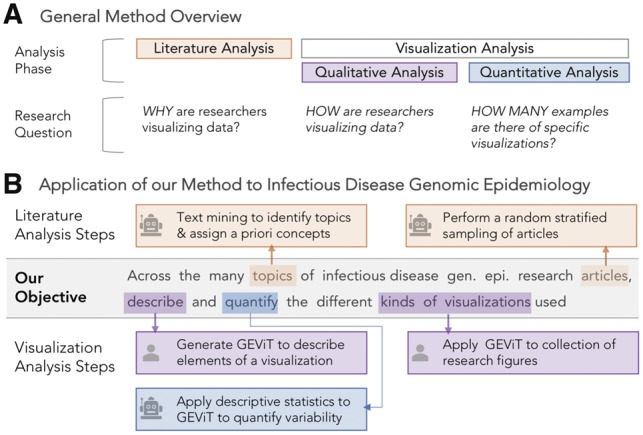
Fig. 1.

Method and Application Overview. (A) Constructing and systematically analyzing a visualization design space requires analysis of both the literature and visualizations themselves, using qualitative and quantitative approaches. (B) Automated steps, as indicated by the robot icon, are used in literature analysis to identify articles in genomic epidemiology and the topics those articles address. Manual steps, as indicated by the human icon, are used in the analysis of visualizations derived from those articles, followed by further quantification with automated statistical approaches. See Supplementary Figure S1 for more details
