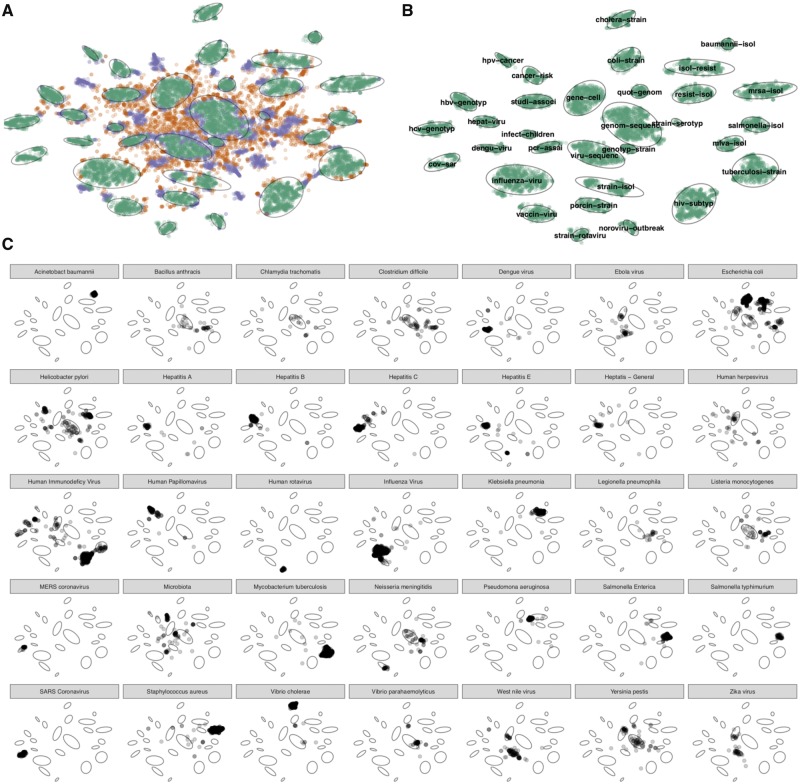
Fig. 3.
Summary of literature analysis results. (A) Documents were classified according to whether they were part of a cluster (green), unclustered under current parameter settings (purple) or never clustered (orange). The 32 cluster boundaries were automatically determined and are shown as light grey ovals. (B) Clustered documents and their topics, which are automatically assigned based upon top two terms with the cluster. (C) Verification of cluster topics against an external list of pathogens. The small multiples show the distribution across the clusters of the pathogen named in the panel header, for the 35 pathogens with 40 or more matching documents

