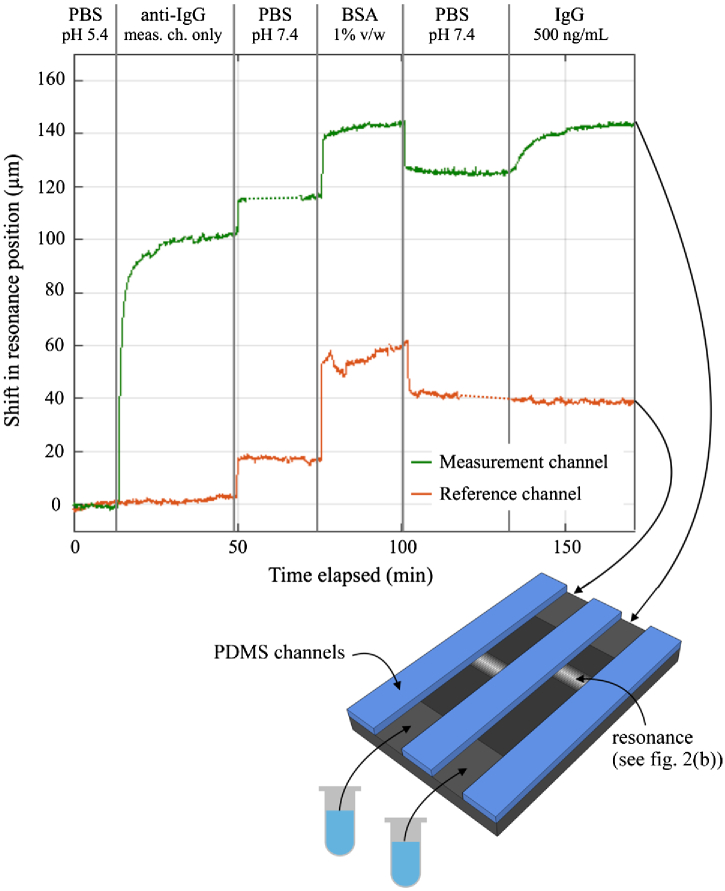
Fig. 4.
IgG binding assay showing the shift in resonance position against time for both the measurement and reference channels, with each assay step indicated. The two small dashed regions on the curves correspond to where the signal was lost momentarily due to the flow channel becoming partially blocked. The illustration underneath shows the flow channel configuration used for the experiment: two separate channels allow one to be functionalized and the other kept as a reference. The analyte was pulled through the channels by a single syringe pump operating with two separate syringes, one for each channel.

