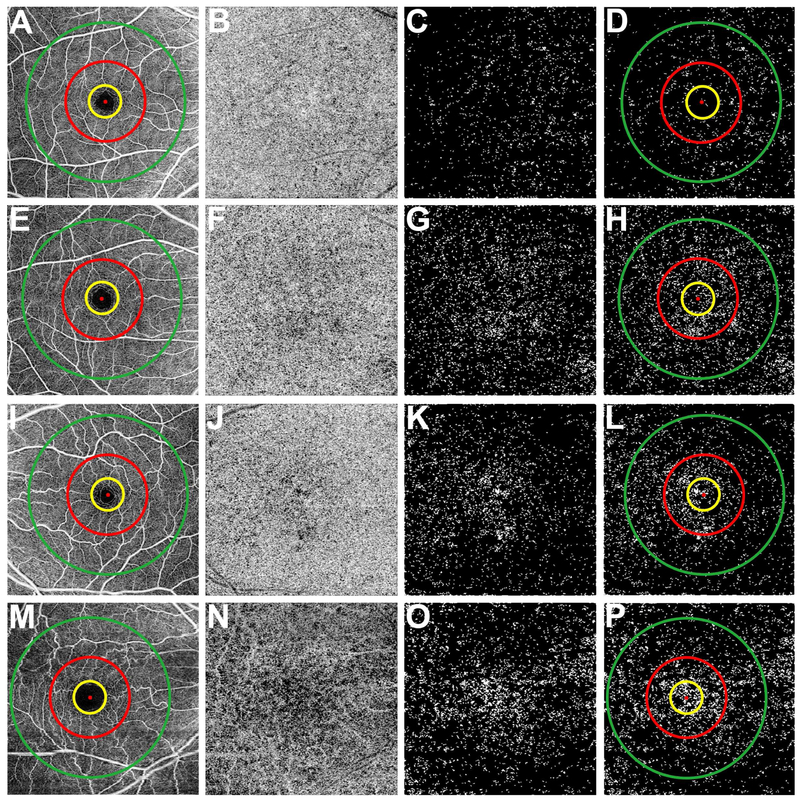
Figure 2: Visualization of the choriocapillaris and the regions used to calculate the percentage of flow deficits from the 6×6 mm scans.
First column (A, E, I, and M): 6×6 mm total retina en face flow images showing the 1 mm diameter yellow circle, 2.5 mm diameter red circle, and the 5 mm diameter green circle centered on the fovea resulting in four regions: the 5 mm circle comprised of a 1 mm circle, a 1.5 mm inner rim, and a 2.5 mm outer rim. Second column (B, F, J, and N): 6×6 mm choriocapillaris en face flow images after artifact removal and structural compensation. Third column (C, G, K, and O): 6×6 mm en face flow image after binarization, thresholding, and removal of flow deficits with diameter smaller than 24 μm. The white areas correspond to the flow deficits. Fourth column (D, H, L, and P): 6×6 mm en face flow deficit images with the circles used to measure the percentage of flow deficits within the regions. (A-P) Correspond to the same subjects shown in Figure 1. (A-D) Images from a 26-year-old subject. (E-H) Images from a 48-year-old subject. (I-L) Images from a 63-year-old subject. (M-P) Images from an 87-year-old subject.

