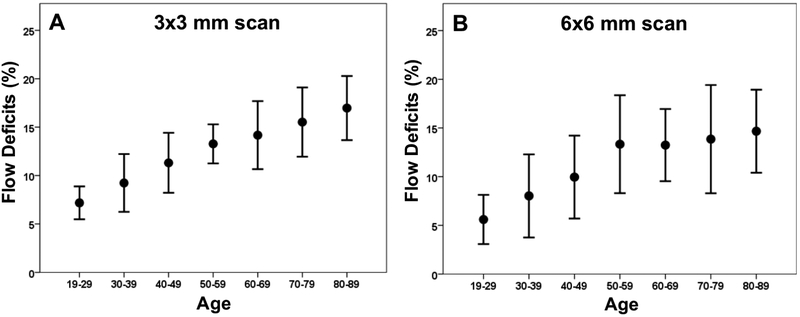
Figure 3: Relationship between the percentage of flow deficits and age within the 2.5 mm circles from the 3×3 mm scans and the 6×6 mm scans.
The average percentage of flow deficits within the 2.5 mm circles centered on the fovea and the corresponding standard deviations are plotted versus each decade of age. (A) 3×3 mm scan. (B) 6×6 mm scan.

