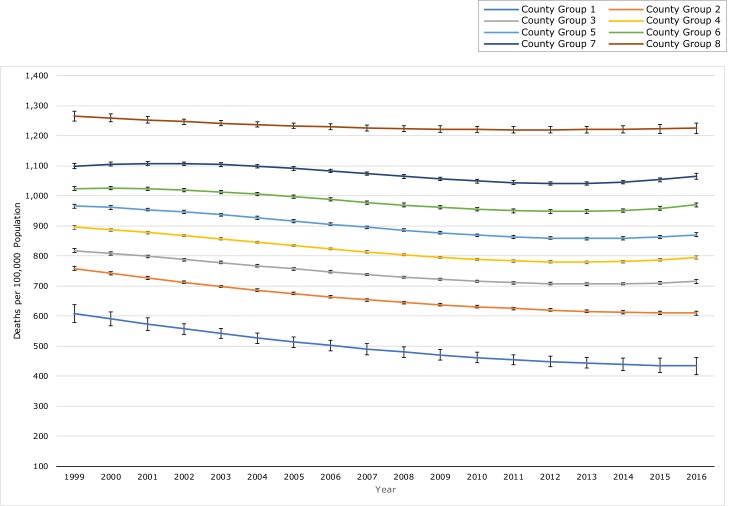
Figure 1.
Age-adjusted mortality rate trajectories for US counties for 8 groups of counties based on group-based trajectory models, 1999–2016. The outcome measure used to generate rate trajectories was the yearly, age-adjusted, all-cause mortality rate of the county. Solid lines correspond to model-predicted values for rates; dotted lines are confidence intervals for the predicted values.
| Year | Group 1 | Group 2 | Group 3 | Group 4 | Group 5 | Group 6 | Group 7 | Group 8 |
|---|---|---|---|---|---|---|---|---|
| 1999 | 609.1 (579.8–638.4) | 758.6 (751.9–765.4) | 818.1 (811.9–824.4) | 895.2 (889.5–900.9) | 966.0 (959.3–972.7) | 1,024.7 (1,017.5–1,031.9) | 1,098.9 (1,089.6–1,108.1) | 1,266.1 (1,249.8–1,282.3) |
| 2000 | 590.7 (566.6–614.8) | 742.3 (736.74–747.8) | 808.7 (804.0–813.5) | 887.3 (883.0–891.7) | 961.1 (955.6–966.7) | 1,025.6 (1,020.0–1,031.2) | 1,105.4 (1,098.5–1,112.4) | 1,259.2 (1,246.1–1,272.2) |
| 2001 | 573.3 (552.9–593.7) | 726.9 (722.2–731.6) | 798.8 (794.5–803.0) | 878.2 (874.3–882.1) | 954.4 (949.1–959.7) | 1,023.6 (1018.5–1028.8) | 1,108.09 (1102.1–1114.1) | 1,252.8 (1242.1–1263.5) |
| 2002 | 556.9 (538.8–575.1) | 712.4 (708.2–716.6) | 788.4 (784.2–792.7) | 868.05 (864.1–872.00) | 946.2 (940.9–951.5) | 1,019.3 (1014.1–1024.6) | 1,107.36 (1101.4–1113.3) | 1,247.0 (1237.8–1256.3) |
| 2003 | 541.6 (524.3–558.8) | 698.9 (694.9–702.9) | 777.9 (773.7–782.2) | 857.2 (853.2–861.3) | 936.9 (931.6–942.3) | 1013.07 (1,007.6–1,018.5) | 1,103.83 (1,097.8–1,109.9) | 1,241.8 (1,233.1–1,250.5) |
| 2004 | 527.2 (510.0–544.5) | 686.4 (682.4–690.4) | 767.5 (763.2–771.8) | 846.0 (842.0–850.1) | 926.8 (921.6–932.1) | 1,005.4 (999.9–1011.0) | 1,098.08 (1,092.0–1,104.2) | 1,237.2 (1,228.3–1246.0) |
| 2005 | 513.9 (496.2–531.6) | 674.8 (670.7–678.9) | 757.2 (753.1–761.4) | 834.8 (830.8–838.8) | 916.3 (911.2–921.4) | 996.8 (991.2–1,002.3) | 1,090.69 (1,084.8–1,096.6) | 1,23315 (1,223.8–1,242.3) |
| 2006 | 501.6 (483.4–519.7) | 664.1 (659.9–668.4) | 747.4 (743.4–751.4) | 823.8 (819.8–827.7) | 905.7 (900.9–910.6) | 987.6 (982.1–993.2) | 1,082.23 (1,076.5–1,088.0) | 1,229.5 (1,219.8–1,239.2) |
| 2007 | 490.2 (471.8–508.7) | 654.4 (650.05–658.8) | 738.2 (734.3–742.1) | 813.3 (809.4–817.2) | 895.4 (890.7–900.0) | 978.4 (972.8–984.0) | 1,073.3 (1,067.7–1,078.9) | 1,226.5 (1,216.47–1,236.56) |
| 2008 | 479.9 (461.5–498.4) | 645.6 (641.3–650.0) | 729.8 (725.9–733.7) | 803.7 (799.8–807.6) | 885.6 (881.17–890.2) | 969.6 (963.9–975.3) | 1,064.4 (1,058.8–1,070.1) | 1,224.1 (1,213.9–1,234.3) |
| 2009 | 470.6 (452.5–488.8) | 637.8 (633.5–642.2) | 722.4 (718.5–726.4) | 795.3 (791.3–799.3) | 876.8 (872.3–881.4) | 961.7 (955.8–967.6) | 1,056.2 (1,050.43–1,062.01) | 1,222.2 (1,212.0–1,232.5) |
| 2010 | 462.4 (444.7–480.0) | 631.0 (626.7–635.3) | 716.2 (712.2–720.3) | 788.4 (784.3–792.6) | 869.3 (864.7–873.9) | 955.2 (949.1–961.3) | 1,049.3 (1,043.3–1,055.3) | 1,220.9 (1,210.9–1,231.1) |
| 2011 | 455.1 (437.8–472.3) | 625.1 (620.8–629.3) | 711.45 (707.3–715.6) | 783.3 (779.0–787.6) | 863.43 (858.7–868.2) | 950.4 (944.2–956.6) | 1,044.1 (1,038.0.0–1,050.3) | 1,220.1 (1,209.9–1,230.3) |
| 2012 | 448.8 (431.6–466.0) | 620.07 (615.73–624.41) | 708.26 (704.09–712.44) | 780.30 (775.99–784.61) | 859.54 (854.69–864.39) | 947.91 (941.73–954.08) | 1041.39 (1035.21–1047.57) | 1219.93 (1209.44–1230.41) |
| 2013 | 443.56 (425.44–461.69) | 616.1 (611.5–620.7) | 706.9 (702.7–711.0) | 779.7 (775.4–784.0) | 858.0 (853.0–862.9) | 948.2 (942.1–954.2) | 1,041.6 (1,035.5–1,047.7) | 1,220.3 (1,209.0–1,231.5) |
| 2014 | 439.3 (419.0–459.7) | 613.0 (607.8–618.1) | 707.5 (703.3–711.7) | 781.9 (777.5–786.3) | 859.1 (853.9–864.3) | 951.6 (945.7–957.5) | 1,045.4 (1039.1–1051.7) | 1,221.2 (1,208.5–1,233.9) |
| 2015 | 436.1 (412.0–460.2) | 610.9 (604.9–616.9) | 710.3 (705.5–715.0) | 787.1 (782.3–791.9) | 863.2 (857.3–869.1) | 958.7 (952.6–964.8) | 1,053.31 (1,045.9–1,060.7) | 1,222.7 (1,207.7–1,237.77) |
| 2016 | 433.88 (404.64–463.12) | 609.69 (602.53–616.85) | 715.44 (709.23–721.65) | 795.70 (789.68–801.71) | 870.72 (863.32–878.13) | 969.93 (962.45–977.41) | 1065.92 (1055.95–1075.90) | 1224.7 (1206.67–1242.73) |

