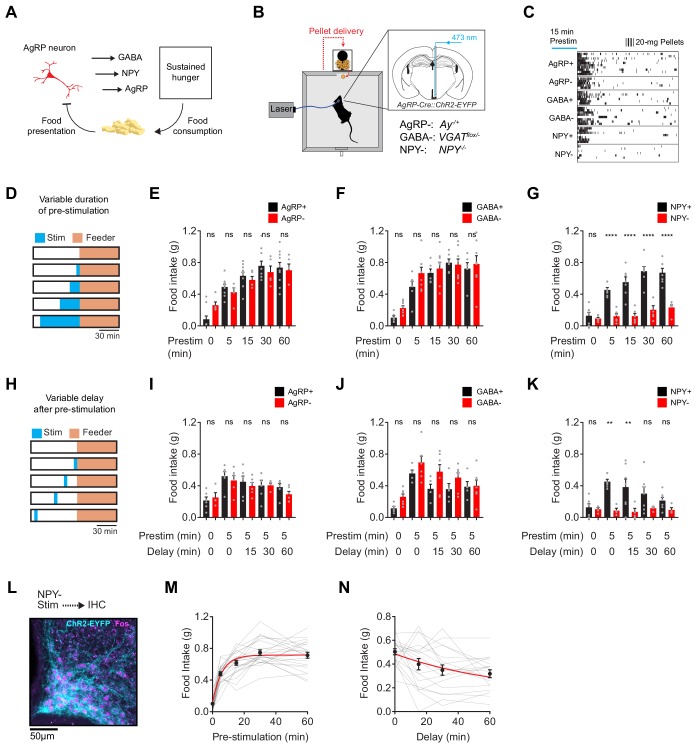
Figure 1. NPY is uniquely required for sustained hunger driven by AgRP neurons.
(a) AgRP neurons are rapidly inhibited by food presentation but nevertheless promote food intake through a sustained hunger signal. (b) System for measuring food intake in response to activation of AgRP neurons in animals with blockade of signaling through AgRP, GABA or NPY (indicated as -) or littermate controls (indicated as +). (c) Raster plot showing pellet consumption of mice with different genotypes in response to pre-stimulation of AgRP neurons (15 min). Each row shows a representative trial from an individual mouse. (d) Feeding behavior paradigm with variable pre-stimulation lengths (blue). (e-g) Food intake (1 hr) following pre-stimulation of variable lengths. Genotypes: AgRP+ (black; N = 10) and AgRP- (red; N = 5) (e), GABA+ (black; N = 6) and GABA- (red; N = 8) (f), and NPY+ (black; N = 7) and NPY- (red; N = 6) (g). (h) Feeding behavior paradigm with variable delay length inserted between the end of pre-stimulation and start of food availability. (i-k) Food intake (1 hr) following pre-stimulation (5 min) and delay of varying lengths. Genotypes: AgRP+ (black; N = 6) and AgRP- (red; N = 6) (i), GABA+ (black; N = 5) and GABA- (red; N = 7) (j), and NPY+ (black; N = 7) and NPY- (red; N = 4) (k). (l) Image of ARC from NPY- mice that received laser stimulation (30 min) in the absence of food before perfusion. Sample was stained for ChR2-EYFP (cyan) and Fos (magenta). (m) Logarithmic growth model of relationship between food intake and pre-stimulation duration (N = 23 mice). (n) Exponential decay model of the relationship between food intake and delay length (N = 18 mice). Error bars in e-g, i-k, m and n represent mean ± SEM. Holm-Sidak multiple comparisons test was used to report adjusted P-values in e-g and i-k. *p<0.05, **p<0.01, ***p<0.001, ****p<0.0001 or ns (not significant) compares adjacent control (black) and experimental (red) group with same pre-stimulation protocol.


