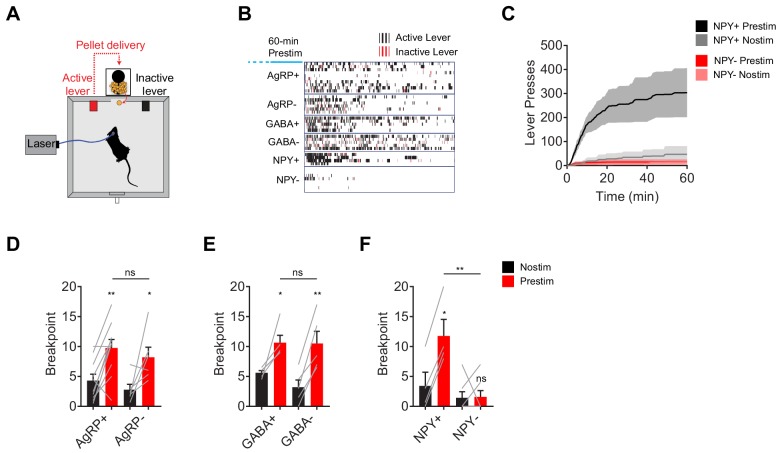
Figure 2. NPY, but not GABA or AgRP, is required for the sustained effect of AgRP neuron stimulation on appetitive behavior.
(a) Schematic for progressive ratio three tasks, in which each successive pellet of food requires the mouse to press the lever three more times than the previous pellet. (b) Raster plot showing active (black) and inactive (red) lever presses of mice of different genotypes following pre-stimulation of AgRP neurons (1 hr). (c) Cumulative number of lever presses for NPY+ (N = 4) and NPY- (N = 7) mice in response to pre-stimulation or no stimulation of AgRP neurons. d-f, Breakpoint of AgRP+ (N = 10) and AgRP- (N = 6) (d), GABA+ (N = 5) and GABA- (N = 5) (e), and NPY+ (N = 4) and NPY- (N = 7) (f) mice in progressive ratio three after pre-stimulation (red) or no stimulation (black). Filled area in c and error bars in d-f represents mean ± SEM. Holm-Sidak multiple comparisons test was used to report adjusted P-value in d-f. *p<0.05, **p<0.01, or ns (not significant) compares adjacent control (black) and experimental (red) group with same pre-stimulation protocol, or compares pairs of groups that are indicated by horizontal lines above.

