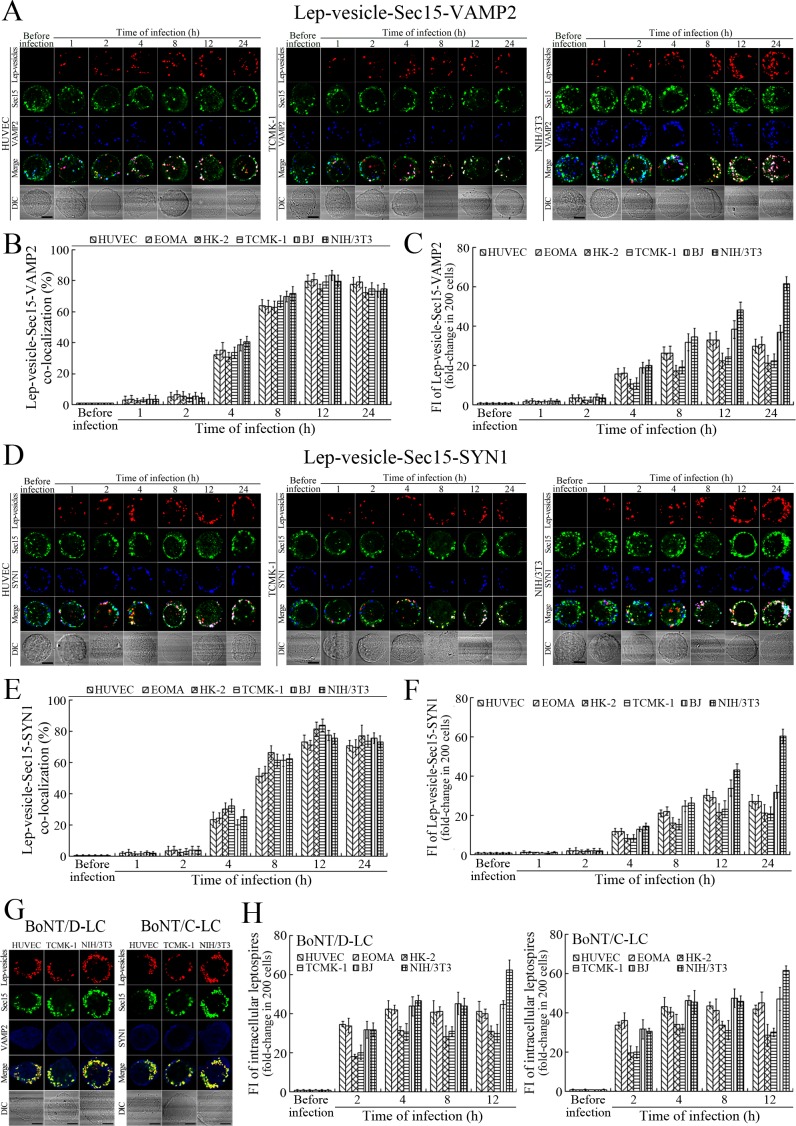
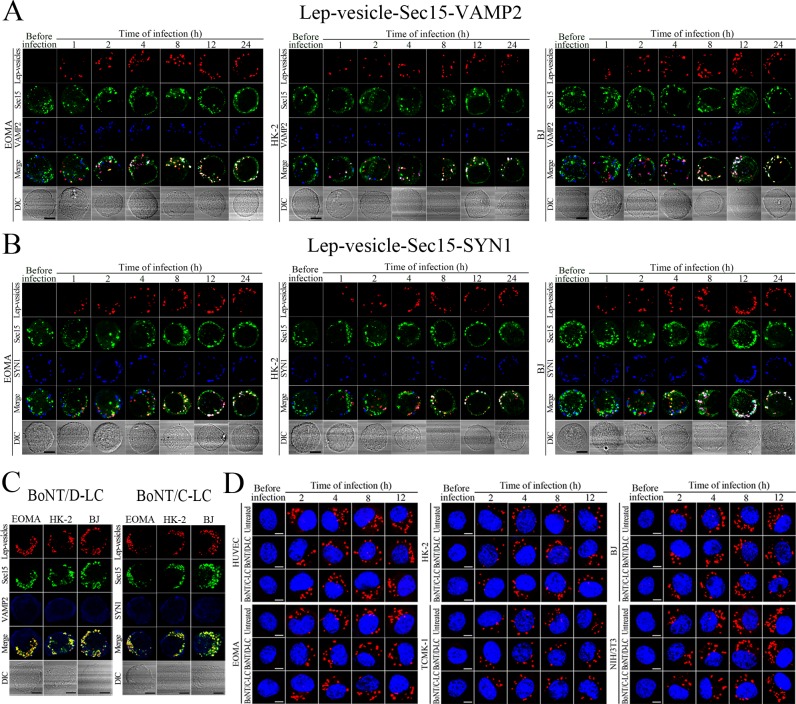
Figure 5. Recycling endosome-exocyst-SNARE complex formation of Lep-vesicles by recruitment of VAMP2/SYN1.
(A) Co-localization of Lep-vesicle-Sec15 with VAMP2 in the cells infected with L. interrogans strain Lai for the indicated times, determined by confocal microscopy (scale bars = 5 μm). The red, green or blue spots indicate the Lep-vesicles, exocyst complex marker Sec15 or SNARE complex marker VAMP2. The white spots indicate the Lep-vesicle-Sec15-VAMP2 co-localization. The Lep-vesicle-Sec15-VAMP2 co-localization in the EOMA, HK-2 and BJ cells during infection was shown in the Figure 5—figure supplement 1A. (B) Statistical summary of Lep-vesicle-Sec15-VAMP2 co-localization percentages for the indicated times. Statistical data from experiments such as shown in (A). Bars show the means ± SD of three independent experiments. Two hundred cells in each experiment were analyzed to calculate the percentages. (C) Statistical summary of white fluorescence intensity values reflecting the Lep-vesicle-Sec15-VAMP2 co-localization for the indicated times. The legends are the same as shown in (B) but for detection of the white fluorescence intensity (FI). The white FI values from the uninfected cells (before infection) were set as 1.0. (D) Co-localization of Lep-vesicle-Sec15 with SYN1 in the cells infected with L. interrogans strain Lai for the indicated times, determined by confocal microscopy (scale bars = 5 μm). The red, green or blue spots indicate the Lep-vesicles-RE, EC marker Sec15 or SNARE-C marker SYN1. The white spots indicate the Lep-vesicle-Sec15-SYN1 co-localization. The Lep-vesicle-Sec15-SNY1 co-localization in the EOMA, HK-2 and BJ cells during infection was shown in the Figure 5—figure supplement 1B. (E) Statistical summary of Lep-vesicle-Sec15-SYN1 co-localization percentages for the indicated times. Statistical data from experiments such as shown in (D). The legends are the same as shown in (B) but for determination of Lep-vesicle-Sec15-SYN1 co-localization percentages. (F) Statistical summary of white fluorescence intensity reflecting the Lep-vesicle-Sec15-SYN1 co-localization for the indicated times. Statistical data from experiments such as shown in (D). The other legends are the same as shown in (C). (G) Absence of Lep-vesicle-exocyst-SNARE complexes in the botulismotoxin-treated cells infected with L. interrogans strain Lai for 12 hr, determined by confocal microscopy (scale bars = 5 μm). No white spots indicating the co-localization of Lep-vesicles with exocyst complex marker Sec15 and SNARE complex markers VAMP2/SYN1 were found. The Lep-vesicle-exocyst-SNARE complexes in the botulismotoxin-treated EOMA, HK-2 and BJ cells at 12 hr post-infection were shown in the Figure 5—figure supplement 1C. (H) Statistical summary of red fluorescence intensity reflecting the leptospires in the botulismotoxin-transfected cells for the indicated times, examined by confocal microscopy. Bars show the means ± SD of three independent experiments. The red fluorescence intensity values from the uninfected cells (before infection) were set as 1.0.


