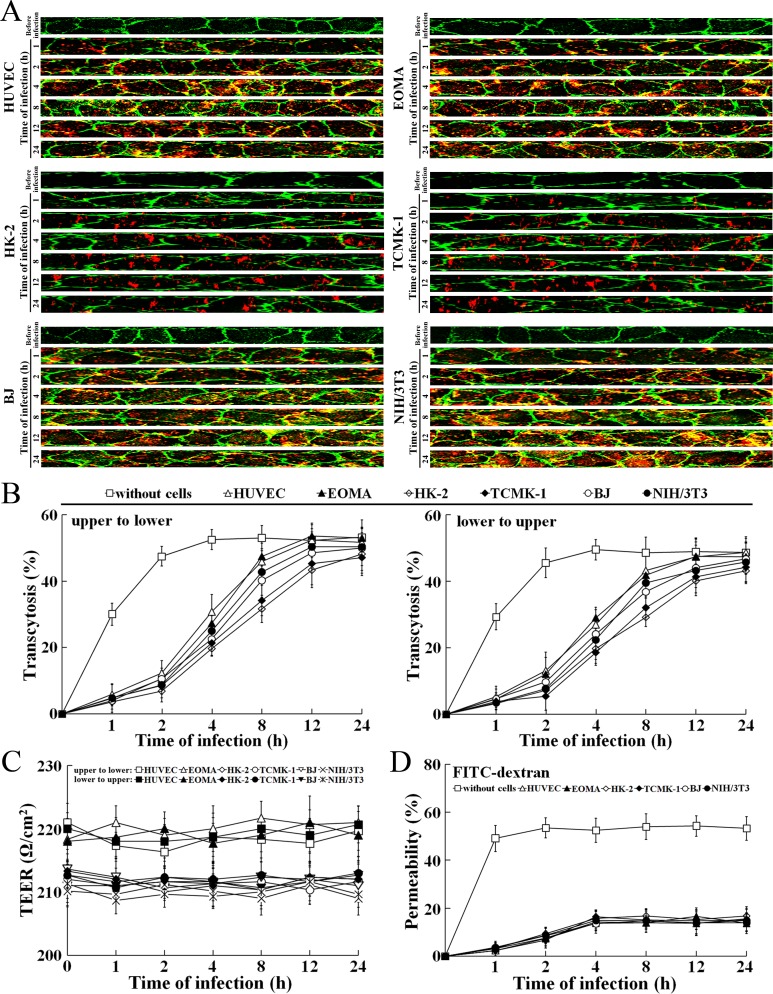
Figure 8. Rapid transcytosis of L. interrogans through different cell monolayers.
(A) Transcytosis of L. interrogans strain Lai through different cell monolayers for the indicated times, examined by confocal microscopy. The green lines indicate the cytomembrane and cellular spaces. The red spots indicate the leptospires passing through cell monolayers. (B) Transcytosis percentages of L. interrogans strain Lai through different cell monolayers for the indicated times, determined by dark field microscopic Petroff-Hausser enumeration. The time points show the means ± SD of three independent experiments. (C) The TEER change of cell monolayers during infection with L. interrogans strain Lai, examined using a cell electric resistance indicator. The time points show the means ± SD of three independent experiments. The TEER values > 200 Ω /cm2 indicate the integrity of cell monolayers and undamage of cells. (D) The permeability percentage of FITC-dextran passing through cell monolayers during infection with L. interrogans strain Lai, detected by spectrofluorometry. The time points show the means ± SD of three independent experiments. The permeability percentages < 15–20% indicate the integrity of cell monolayers and undamage of cells.

