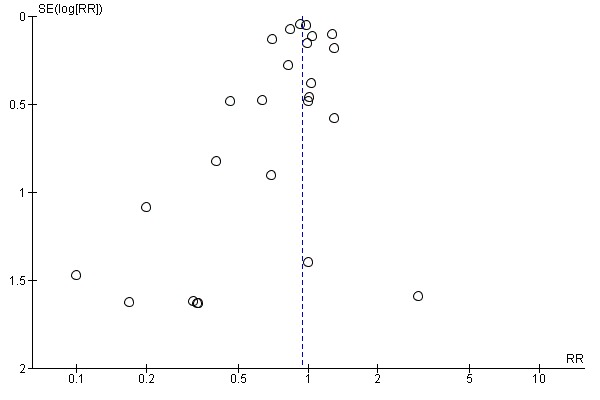
Figure 4.

Funnel plot of comparison: 1 High vs low LCn3 omega‐3 fats (primary outcomes), outcome: 1.11 Cardiovascular mortality (overall) – LCn3.

Funnel plot of comparison: 1 High vs low LCn3 omega‐3 fats (primary outcomes), outcome: 1.11 Cardiovascular mortality (overall) – LCn3.