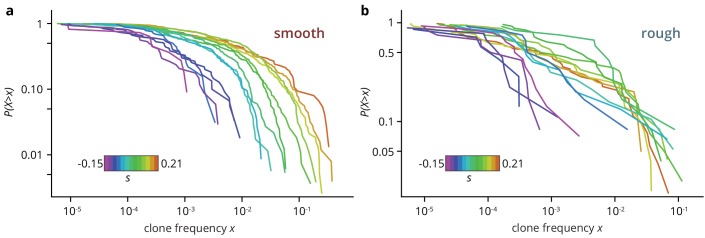
Figure 3. Clone size distribution for colonies grown on smooth (a) and rough (b) substrates.
Deleterious mutants are shown in magenta tones; their clones are typically small. Neutral clones are shown in green; their size distribution had a broad tail. Advantageous mutations in smooth colonies were even more broadly distributed, as large sectors establish more often. By contrast, beneficial clones in rough colonies had size distributions that were indistinguishable from the distribution for neutral mutations.

