. 2019 Apr 12;8:e44359. doi: 10.7554/eLife.44359

Figure 4. A minimal model captures the change in colony morphology in heterogeneous environments.

(a) The simulation proceeds by allowing cells with empty neighbors ('boundary sites’) to divide into empty space. Disorder sites (gray/black, density ρ) are randomly distributed over the lattice. (b) As the obstacle transparency, that is the growth rate k at disorder sites, is reduced, the colony expansion speed decreases as a function of the obstacle density. For impassable disorder sites ('obstacles’, k=0), the expansion speed vanishes above a critical obstacle density ρc0.4, beyond which the population was trapped and could not grow to full size. (c) As ρ approached ρc colony morphology became increasing fractal. Colors from red to blue show the colony shape at different times. (d) Near the critical obstacle density ρc0.4, only few individual sites near the front have empty neighbors, leading to local pinning of the front (arrows), where the front can only progress by lateral growth into the pinned region.

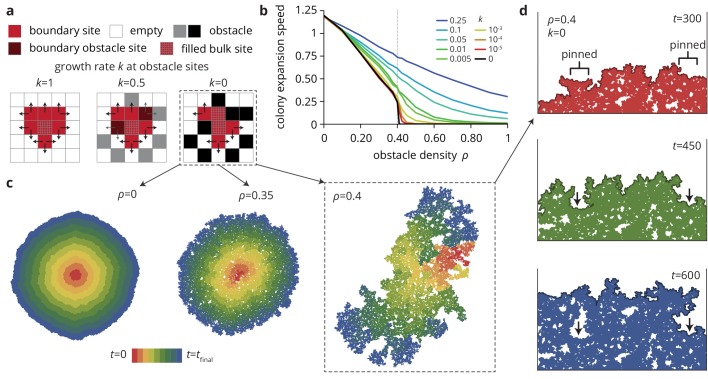
Figure 4—source data 1. Source data for Figure 4 (Colony expansion rate in heterogeneous environments).
DOI: 10.7554/eLife.44359.027

Figure 4.

Figure 4—figure supplement 1. Characterization of Eden clusters with obstacles (k=0).

Figure 4—figure supplement 1.

(a) Taking the front speed v as the order parameter, there is a phase transition at a critical obstacle density ρc(L) depending on system size L. For an infinite system, ρc0.41±0.01. For ρ<ρc, we have v|ρ-ρc|0.21. (b) Roughness W of fully developed interfaces at L=400 for varying obstacle densities, as a function of the window length l, such that Wtα. At ρ=0, we find α=1/2, consistent with the KPZ universality class. At ρc, we find αloc0.9, consistent with the QEW universality class (see Theory in the Materials and methods section), which is known to be characterized by two roughness exponents, a local exponent (αloc, panel b), and a global exponent αG1.15>αloc when the roughness is measured over the whole system size (see panel c) (Amaral et al., 1995). Importantly for 0<ρ<ρc, there is a crossover length scale below which the system displays QEW scaling, whereas it returns to the KPZ scaling on longer length scales. (d) The time evolution W(t)tβ of the interface also follows dynamics consistent with KPZ (β=1/3) and QEW (β0.78) in the limiting cases. For intermediate 0ρρc, there is a crossover from qEW at short times to KPZ dynamics at longer times, before the roughness saturates at a ρ-dependent value. For easier analysis, all simulations were performed in a box-like geometry.
Figure 4—figure supplement 1—source data 1. Source data for Figure 4—figure supplement 1 (Analysis of colony expansion rate (v(rho).xlsx), interface width as a function of window length (w(l).xslx) and time (w(t).xslx), and saturation width (Wsat.xlsx)).
DOI: 10.7554/eLife.44359.026