. 2019 Apr 12;8:e44359. doi: 10.7554/eLife.44359

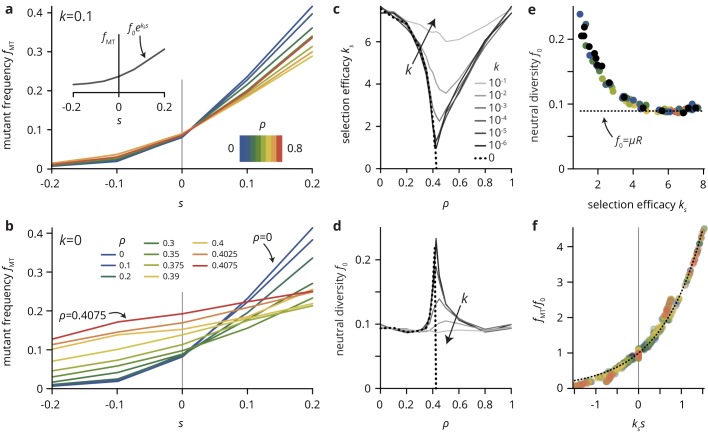
Figure 5. A simple lattice model reproduces strong impact of environmental heterogeneity on evolutionary dynamics.

(a,b) The mutant frequency fMT as a function of the selective advantage s of the mutants always increases with s to a degree that depends on the density ρ and the transparency k of the disorder sites. (c,d) Parametrizing the mutant frequency for various values of k and ρ heuristically with fMT=f0ekss (panel a, inset), we fit the neutral diversity f0 (shown in panel d) and the selection efficacy ks (panel c). The selection efficacy ks serves as an inverse selection scale, describing the dependence of fMT on s. (e) A scatter plot of the fit parameters f0 and ks for all values of k and ρ reveals that they are effectively not independent parameters, but that f0 entirely determines ks and vice-versa (for a given population size N and mutation rate μ; here, N=105 and μ=0.0005). The dashed line represents the expect neutral diversity for a circular colony, where f0=μR, with R=N/π the colony radius (Fusco et al., 2016). (f) Rescaling all curves by fitted values of ks and f0, all points fall close to a master curve given by ekss (dashed line), motivating the parametrization introduced in (a).

Figure 5—source data 1. Source data for Figure 5.
ks_values.csv. Source data for panel c (fit parameter ks for various parameter values ρ and k). f0 values.csv Source data for panel d (fit parameter f0 for various parameter values ρ and k). rescaled fMT data.xlsx Source data for panel f (rescaled fMT for various parameter values ρ and k).
DOI: 10.7554/eLife.44359.031

Figure 5.

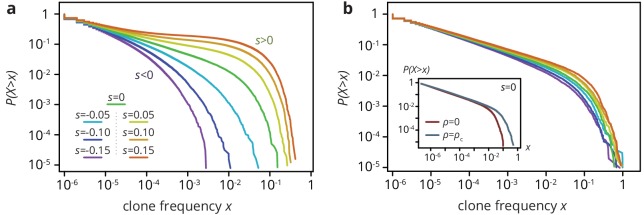
Figure 5—figure supplement 1. Clone size distribution P(X>x) for colonies grown on smooth (a) and rough (b) substrates in simulations.

Figure 5—figure supplement 1.

Deleterious mutants are shown in magenta tones; their clones are typically small. Neutral clones are shown green; their size distribution is broad. Advantageous mutations (red tones) are even more broadly distributed, as large sectors establish more often. In the absence of environmental heterogeneity, the clone size distribution P(X>x) was very broad, with a low-frequency power-law regime x-2/5 corresponding to mutant bubbles and a steeper power-law at high frequencies characterizing sector sizes (Fusco et al., 2016). A deleterious fitness effect s of the mutations created an effective cut-off because sectors no longer formed, whereas positive s increased the likelihood of high-frequency clones, because sectors establish more often and grow to larger frequencies when they do. At the critical obstacle density, we found that a neutral clone size distribution that was remarkably similar to what we found without environmental heterogeneity (b, inset). By contrast, selective differences between mutants and wild type had a much less pronounced effect on the clone size distribution as the density of obstacles increased. The clone size distribution for both beneficial and deleterious mutations thus resembled the distribution for neutral mutations. In simulations at the critical obstacle density ρ=ρc, P(X>x) became roughly independent of s, such that fitness effects associated with the mutations were effectively inconsequential at the level of individual clones.
Figure 5—figure supplement 1—source data 1. Source data for Figure 5—figure supplement 1 (Clone size distribution for various s for ρ=0 and ρ=0.4).
DOI: 10.7554/eLife.44359.030