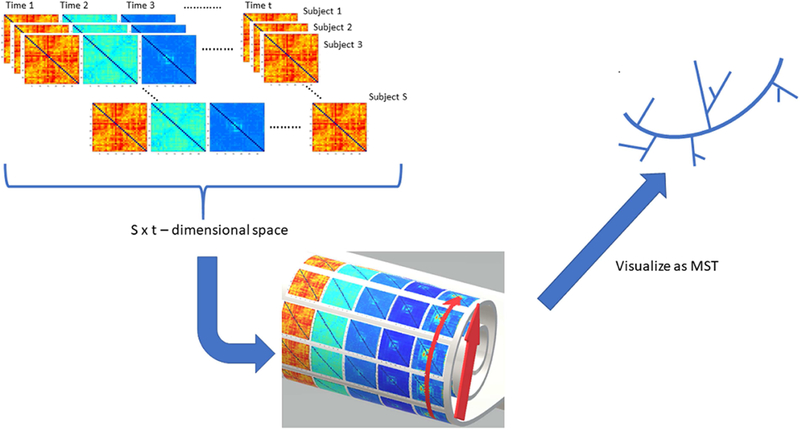
Fig. 1: Constructing the dynamic phase-space and visualizing the minimum spanning tree.

This figure illustrates the basic idea of our phase-space manifold reconstruction framework. Dynamic connectomes are generated from EEG data using a sliding window approach. Each connectome (from all subjects and all time points), mathematically defined as a 34 by 34 matrix, is mapped onto a point on a manifold that is embedded in a high dimensional space (here the manifold is depicted as a Swiss roll, a 2-dimensional structure that is rolled up and embedded in 3D). +-Thus, the distance in the high dimensional space (straight arrow) is not the manifold geodesic distance (curved arrow), which encodes the intrinsic geometric features of the manifold. This distance is used to create the neighborhood graph visualized as minimum
