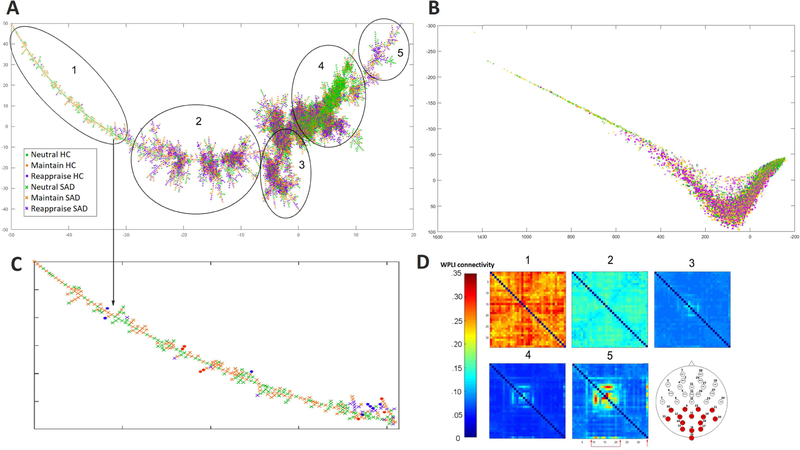
Fig. 2: The reconstructed MST (A) and the corresponding 2D isomap representation (B) of the reconstructed phase-space manifold.
Visually, the “left” MST branch primarily comprises connectomes from SAD subjects while Neutral connectomes appear to form a distinct cluster (sections 1 and 4). Enlarged “left branch” view is in (C). Since each point corresponds to a connectome, we averaged within key sections along the main MST branch and visualized the respective average connectomes in (D). These representative average connectomes exhibit an ordered transition, with emerging connections among parietal and occipital channels (indicated with arrows in section 5 and red channels on the head map) as we move towards the “right branch”.) Two-dimensional isomap representation of the same manifold exhibits similar task and group distribution compared with MST (B).

