
Fig. 4: Neutral connectomes marked by HAM-A scale on MST (A) and Frequency of connectomes to the left of the x-axis threshold (B).
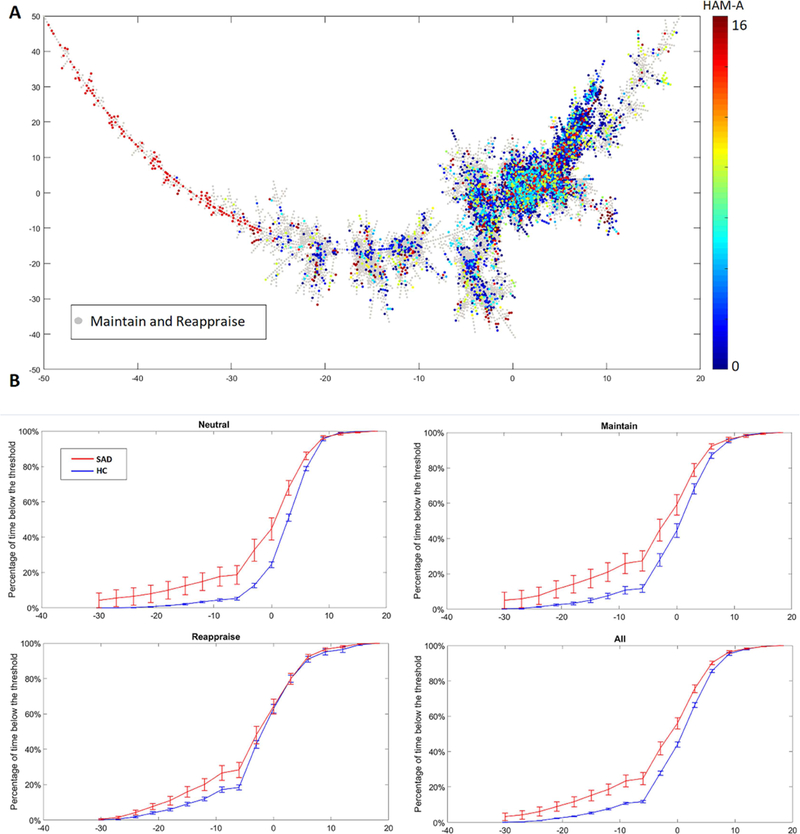
Phase-space trajectories from SAD participants are more likely to visit the “left side” of the MST. With a sliding threshold (x-axis), the frequencies of trajectories (y-axis) crossing to the left of the threshold are computed and compared between SAD participants and healthy controls (HC). Area under the curve analysis revealed a significant task effect (p = 1.8 × 10⁻⁷), a significant group effect (p = .019), and trend level task x group effect (p = .051).