Figure 2.

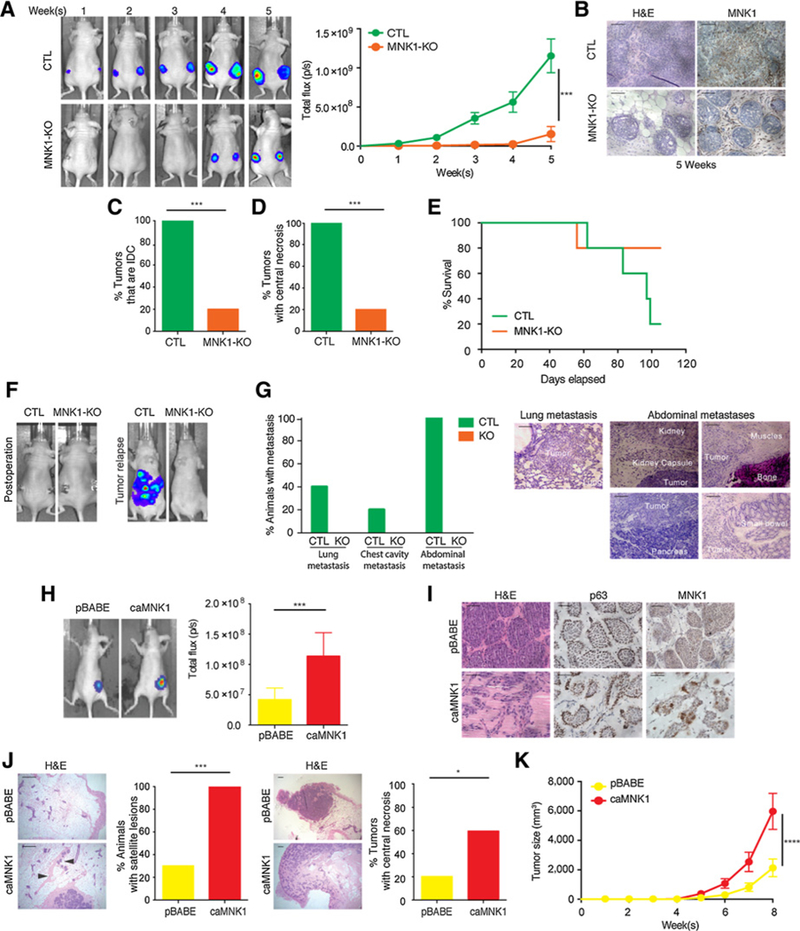
MNK1 regulates the DCIS-IDC transition in vivo. A, DCIS-Luc CTL and MNK1-KO tumor outgrowth is measured by IVIS imaging. B, MNK1 knockout is retained in the DCIS-Luc MNK1-KO xenografts as confirmed by IHC. Scale bar, 50 μm. C, All DCIS-Luc CTL xenografts have progressed into IDC, while only 20% DCIS-Luc MNK1-KO tumors have progressed to an IDC-like morphology. D, All DCIS-Luc CTL xenografts have central necrosis, while only 20% DCIS-Luc MNK1-KO tumors have central necrosis. E, Survival curve of mice receiving DCIS-Luc CTL/MNK1-KO cells. F, Representative IVIS imaging showing complete tumor removal postoperation and tumor recurrence in animals receiving DCIS-Luc CTL cells. G, Percentage of animals presented with metastasis at different sites and representative images of metastasis in various tissues of mice receiving DCIS-Luc CTL/MNK1-KO cells. Scale bar, 200 μm. H, Tumor outgrowth is measured by IVIS imaging. I, DCIS-Luc pBABE xenografts maintain DCIS morphology, while DCIS-Luc caMNK1 tumors have progressed into a mixed morphology of DCIS/IDC. caMNKI overexpression is maintained in the xenografts as confirmed by IHC. Scale bar, 50 μm. J, 100% of mice with DCIS-Luc caMNK1 tumors have micrometastasis in the mammary gland, while 30% of DCIS-Luc pBABE have micrometastasis. Arrows, micrometastases. Sixty percent DCIS-Luc caMNK1 and 20% DCIS-Luc pBABE tumors have central necrosis. Scale bar, 200 μm. K, DCIS-Luc caMNK1 xenografts present with growth advantage over DCIS-Luc pBABE controls. H&E, hematoxylin and eosin. ***, P < 0.001; ****, P< 0.0001.
