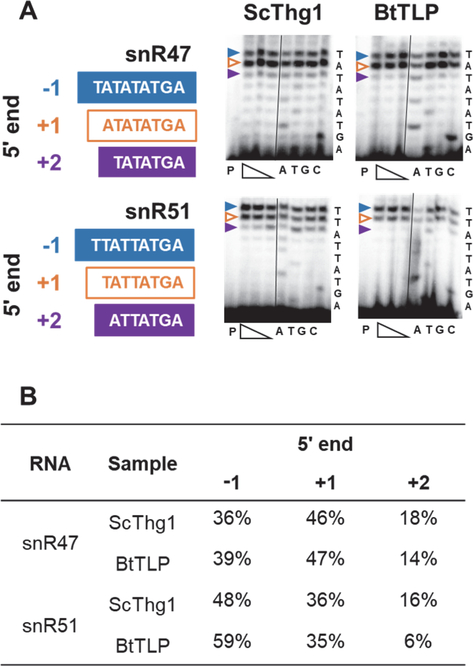
Figure 4. snR47 and 51 exhibit an increase in population ending at the −1 position from the ScThg1 to the BtTLP complemented strain.
A) Primer extension assays were used to analyze RNA from the ScThg1- or BtTLP-complemented strains, as indicated. Expected 5’-end sequence of each snoRNA is listed to the right of each primer extension panel. The identity of the band corresponding to each 5’-end stop position is indicated by colored arrows, with blue corresponding to −1-terminating product, white with orange outline corresponding to +1 terminating product (annotated 5’-end), and purple corresponding to +2-terminating product. Each primer extension experiment contains primer only control (lane P), followed by three experimental lanes with the indicated target RNA extended in the presence of a range of dNTP concentration (400, 150, and 50 μM). The dNTP titration was used to ensure that observed primer extension products correspond to the actual RNA 5’-end, and not to additional nucleotide incorporation by RT (which can be observed at very high dNTP concentrations). The similar patterns of primer extension products observed here across the concentration range suggests that the length of each cDNA product represents an actual RNA 5’-end. Lanes labeled A,T,G,C correspond to sequencing lanes performed in the presence of the indicated ddNTP. B) Quantification of the representative assay shown in panel A to measure percent of total primer extension products corresponding to each 5’-end stop position for the indicated RNAs from each strain. Extension results were quantified using the reactions containing 150 μM dNTP (middle concentration of the three extension lanes).

