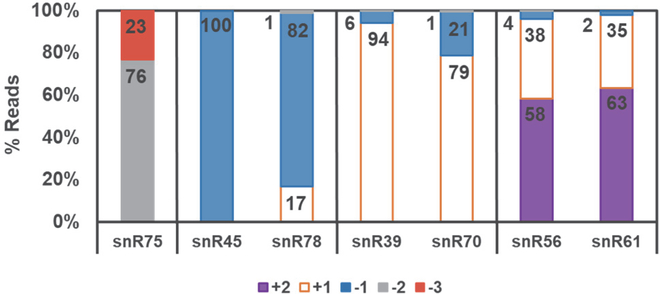
Figure 5. 5’-end heterogeneity is predicted by RNA-Seq.
For each indicated snoRNA analyzed in the ScThg1-expressing (control) strain described in methods, the fraction of 5’-end containing reads that correspond to the specified 5’-end nucleotides was quantified and shown as a percent of total 5’-end-containing reads. The annotated 5’-end for each RNA (+1 position) is indicated by white bars with orange outline. Other observed 5’-ends are indicated by red (−3), gray (−2) or blue (−1) for reads corresponding to sequences with additional 5’-nucleotides relative to the annotated RNA start, or purple (+2) corresponding to sequences with shorter 5’-ends relative to the annotated RNA start site.

