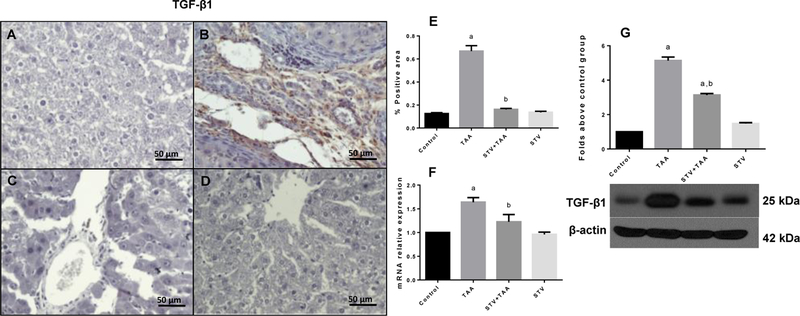
Figure 3. STV downregulates TGF-β1 in fibrotic livers.
Immunohistochemistry TGF-β1 obtained from livers of control rats (A); TAA-treated rats (B); STV+TAA-treated rats (C) and rats administered with STV alone (D). Histogram depicts the percentage of positivity TGF-β1 obtained from immunohistochemistry slices (E). Increase in relative mRNA expression of TGF-β1 (F) is shown. Protein expression level of TGF-β1 was measured by western blot from liver slices (G). β-actin was used as a control. The values are expressed as a fold increase of optical densitometry normalized to the control group values (control = 1). Each bar represents the mean value of experiments conducted in duplicate assays ± SEM (n = 3). ap < 0.05 vs control. bp < 0.05 vs TAA.

