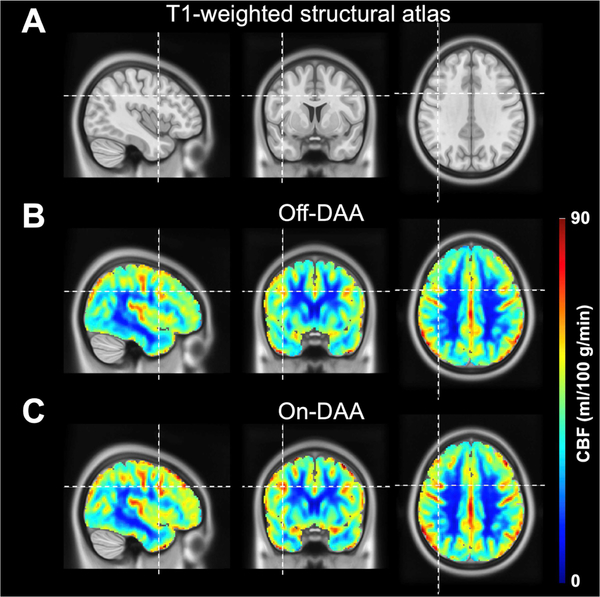
Fig. 3.
A) Orthogonal representation of a T1-weighted anatomical atlas, along with mean quantitative CBF maps (ml/100 g/min) across subjects in the (B) Off-DAA and (C) On-DAA states. Increases in rCBF in several regions, including the DLPFC (indicated by the cursor) and pre-SMA, were observed in the On-DAA condition.

