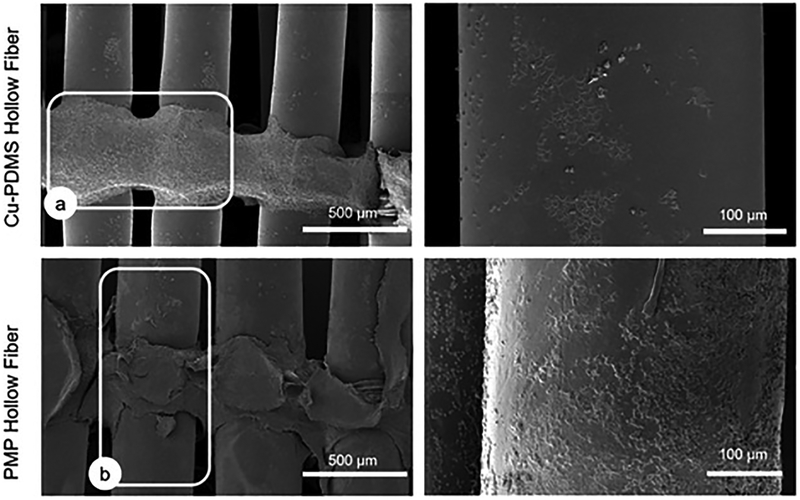
Figure 9.
Representative SEM images of gas exchanging fibers and weaving fibers. (a) outlines a weaving fiber with pronounced protein deposition and (b) outlines a gas exchanging fiber. These are figures representing worst case scenarios, failed devices looking at the middle of the fiber bundle. (87.5% of the PMP devices and 50% of the Cu-PDMS devices)

