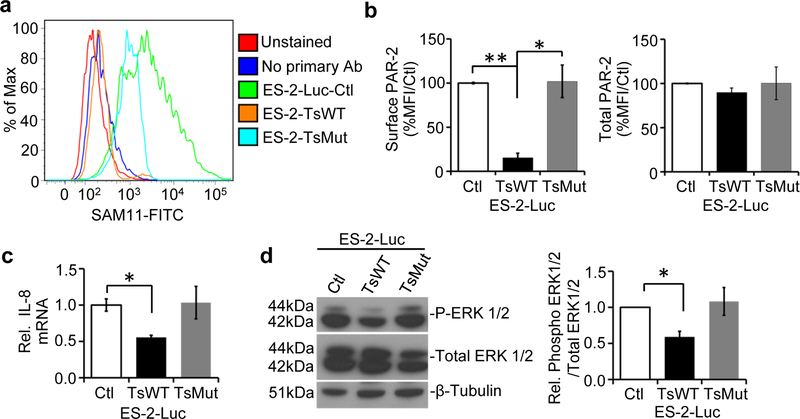
Fig 4.
Testisin targets PAR-2 on the surface of ES-2-Luc ovarian cancer cells. a. Representative flow cytometry of non-permeabilized ES-2-Luc-TsWT, ES-2-TsMut and ES-2-Luc-Ctl cells stained for surface PAR-2 expression using the SAM11 antibody. Unstained cells or those stained with secondary alone served as negative controls. The surface PAR-2 expression in the presence of testisin was similar to the negative control cells, indicating a significant loss of PAR-2 cell surface expression accompanies increased testisin expression in the ES-2-Luc cells. b. Quantification of fluorescent signals show the significant loss of PAR-2 from the surface of ES-2-Luc-TsWT cells compared to ES-2-Luc-Ctl or ES-2-Luc-TsMut. Total PAR-2 expression, measured in permeabilized cells by flow cytometry, was similar for ES-2-Luc-TsWT cells, ES-2-Luc-Ctl and ES-2-Luc-TsMut cells. Graphs are mean +/− std. error from 2 independent experiments, *p<0.05; **p<0.01, unpaired t-test. c. qPCR analysis of mRNA isolated from ES-2-Luc-TsWT, ES-2-Luc-TsMut or ES-2-Luc-Ctl demonstrate testisin proteolytic activity significantly reduces expression of IL-8 compared to ES-2-Luc-Ctl cells. The graph represents the mean +/− SEM from three independent experiments. *p<0.05, unpaired t-test. d. Western blot analysis of ERK1/2 activation in ES-2-Luc-TsWT, ES-2-Luc-TsMut and ES-2-Luc-Ctl cell lines. Blots were probed with antibodies against phosphorylated-ERK1/2 and total ERK1/2. Graph shows densitometric analysis of phosphorylated ERK1/2 protein relative to total ERK1/2 after normalizing to β-tubulin. Graphs show mean +/− SEM and are the average of at least 2 independent experiments. * p<0.05, unpaired t-test.

