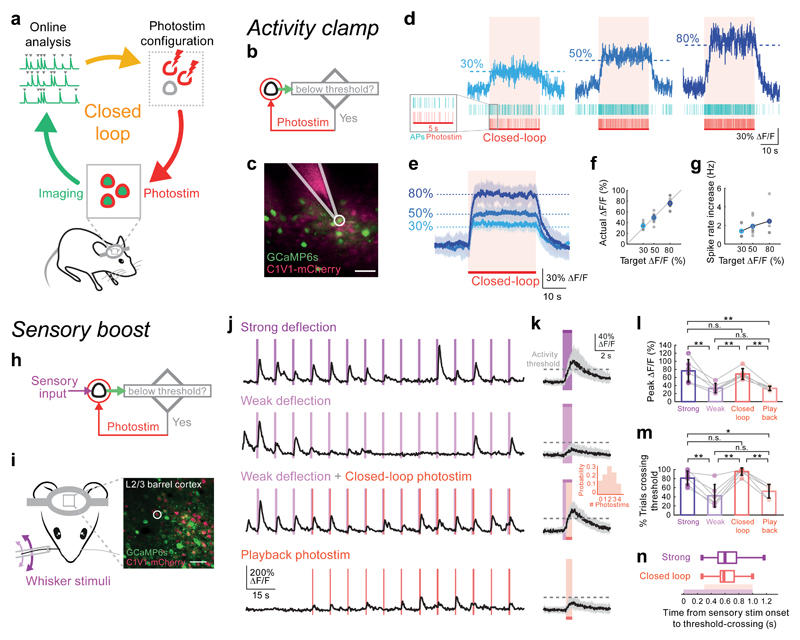
Figure 1. Targeted closed-loop all-optical readout and control in vivo.
(a) Schematic illustration of the closed-loop all-optical control system in which two-photon imaging is combined with simultaneous two-photon photostimulation. Readout and control are coupled by tailoring the photostimulation according to measurement of ongoing activity. Activity traces are extracted online from two-photon calcium imaging movies and real-time analysis detects events used to tailor the photostimulation rate and/or targets.
(b) Experimental strategy for the ‘activity clamp’ paradigm. A single neuron is photostimulated (spiral scan; 20 μm in diameter; 10-20 ms duration; 30 mW on sample, Fidelity laser or 10 mW on sample, Satsuma laser) whenever its calcium signal recorded online falls below a defined threshold.
(c) Simultaneous cell-attached recording from a neuron (white circle) that was under ‘activity clamp’ in layer 2/3 of mouse somatosensory cortex expressing GCaMP6s (green) and C1V1 (pink, scale bar 50 μm, 50 mW on sample, Chameleon laser). Alexa 594 was put in the pipette for visualization.
(d) Top: calcium transient from a single neuron clamped at 3 different activity levels (30, 50, 80% ΔF/F; 30 sec clamping period). Middle: raster plot of electrophysiologically recorded action potentials (APs) from the neuron in (c) during single trials. Bottom: photostimulation times.
(e) Average activity clamp (30 second clamp period) of 18 cells in somatosensory and visual cortex of awake animals. Shaded area is SD. Same photostimulation parameters as in (d). n = 18 cells in 6 animals.
(f) Calcium signal levels achieved during activity clamp in (e) versus the target calcium signal levels. Gray points are individual cells, colored points are average.
(g) Spike rate increase during activity clamp at three different target calcium signal levels, measured by simultaneous electrophysiological recording (n = 7 cells in 5 mice under anesthesia).
(h) Experimental strategy for closed-loop boosting of sensory responses: a sensory-responsive neuron was photostimulated if the sensory-evoked activity failed to reach a threshold.
(i) Left: configuration of whisker stimulation and two-photon imaging. Right: a field of view (scale bar, 50 μm, 30 mW on sample, Chameleon laser) showing neurons co-expressing GCaMP6s and C1V1-2A-mCherry in the C2 barrel of mouse somatosensory cortex. A neuron that responded to single whisker deflections was selected as the target (white circle).
(j) Calcium transients from the target neuron in (i) recorded while the mouse was presented with a train of single whisker deflections (20 Hz, 1 sec sinusoidal deflection once every 10 sec). Top row: the neuron responds strongly to strong whisker deflections. Second row: the neuron responds weakly and unreliably to weak whisker stimuli. Third row: neural responses to weak whisker deflection were boosted by photostimulation (red lines; stimulation duration 50 ms, 9 mW on sample, Satsuma laser) if the activity recorded online is below a pre-defined threshold after 300 ms from the onset of the whisker deflection until the end of the deflection. Bottom row: playback photostimuli in the closed-loop trials.
(k) Calcium transients during individual sensory stimulation trials (black traces are the median value of all trials; gray shaded areas show the inter-quartile ranges (25% to 75% quantiles); n = 6 stimulus responsive neurons in 4 animals). First panel: large increase in calcium signal during a strong sensory stimulus. Second panel: weak responses to weak sensory stimuli. Third panel: photostimulation boosted the calcium signal to pass the user-defined activity threshold (30% ΔF/F) during closed-loop intervention (stimulation duration 50 - 80 ms; 6 - 12 mW on sample, Satsuma laser; inset shows that on average 2 photostimuli were delivered per trial). Fourth panel: photostimulation alone was not able to drive the calcium signal above threshold. Purple: 1 sec whisker stimulation; red: closed-loop intervention.
(l) The peak neural response to weak sensory stimuli with closed-loop intervention (Average ΔF/F: 68.6% ± 13.5%) was similar to the response to strong sensory stimuli (Average ΔF/F: 76.5% ± 27.9%); P = 0.00014, one-way ANOVA, ** P = 0.0013, strong versus weak (Average ΔF/F: 33.5% ± 11.5%); ** P = 0.0011, weak versus closed-loop; ** P = 0.007 closed-loop versus playback; n.s. P = 0.84, strong versus closed-loop; n.s. (not significant) P = 0.99, weak versus playback; ** P = 0.0011, strong versus playback; n = 6 cells in 4 animals. Measure of center is mean; error bars correspond to standard deviation).
(m) Percentage of trials that showed strong neural activity (ΔF/F response to stimulation > 30%) after the sensory stimulus. The ΔF/F response to sensory stimulation passed the activity threshold in 42.2 ± 24.7% of weak sensory stimulation trials, 81.1 ± 15.4% of strong sensory stimulation trials and 95.6 ± 8.1% of weak sensory stimulation trials with closed-loop photostimulation. When closed-loop intervention was enabled, the neural response to weak sensory stimuli was as reliable as the response to strong sensory stimuli (P = 0.00006, one-way ANOVA, ** P = 0.0037, strong versus weak; ** P = 0.0001, weak versus closed-loop; ** P = 0.0013 closed-loop versus playback; n.s. P = 0.47, strong versus closed-loop; n.s. P = 0.74, weak versus playback; * P = 0.036, strong versus playback; n = 6 cells in 4 animals. Measure of center is mean; error bars correspond to standard deviation).
(n) The time taken for sensory-evoked responses to cross the 30% ΔF/F threshold for strong sensory-evoked responses (top values) and weak sensory-evoked responses boosted by photostimulation (bottom values). Purple bar: whisker stimulation window; red: photostimulation window. Data are presented as box-and-whisker plots displaying median, interquartile and 90% ranges; the interquartile range was 500 to 767 ms after the onset of strong sensory stimulation, compared with 533 to 733 ms after the onset of weak sensory stimulation with closed-loop photostimulation (P = 0.33, Wilcoxon signed-rank test, n = 90 trials, 6 cells in 4 animals).

