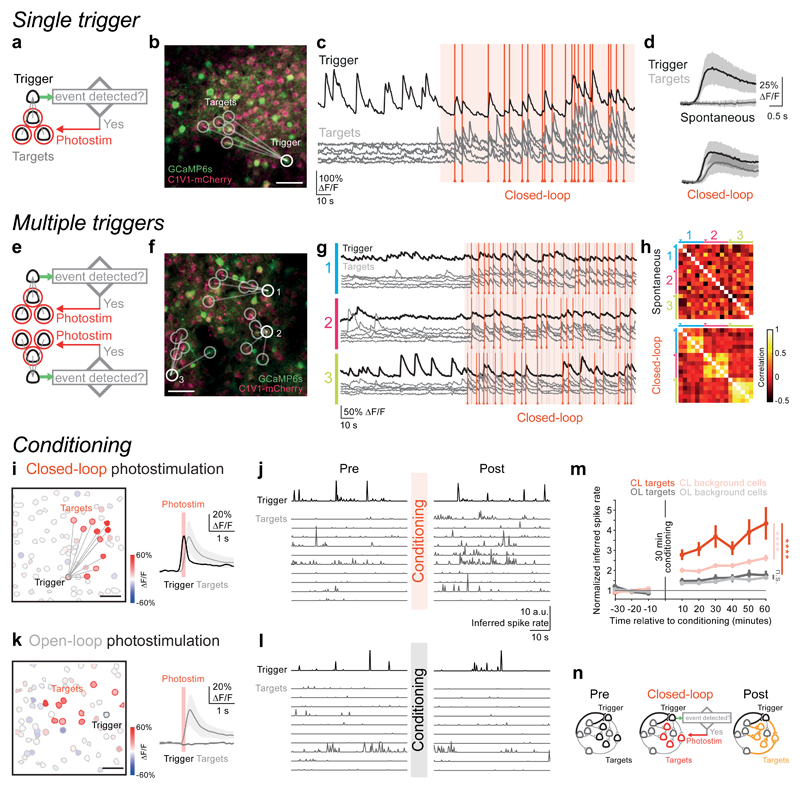
Figure 2. Online activity-guided photostimulation of neuronal ensembles can induce long-term plasticity of network activity.
(a) Experimental strategy: dynamic interrogation of ensembles with a single trigger neuron and multiple targets. A group of ‘target neurons’ was photostimulated (5 × 10 ms spiral stimulation of target neurons, 30 mW per cell, Fidelity laser) when an event was detected in the pre-defined ‘trigger neuron’.
(b) A field of view in layer 2/3 of mouse somatosensory cortex co-expressing GCaMP6s (green) and C1V1-2A-mCherry (pink; scale bar, 50 μm, 50 mW on sample, Chameleon laser) in an awake mouse. A trigger neuron (thick white circle) was selected to drive photostimulation of 5 pre-defined target neurons (thin white circles; representative example of 6 independent experiments with similar results).
(c) Top: calcium signal recorded from the trigger neuron. Bottom: calcium signal traces recorded simultaneously from the target neurons. We activated target neurons by photostimulation (red vertical lines) upon detection of an event in the trigger neuron during the closed-loop control period (140 s, shaded area).
(d) Calcium transients (mean ± SD) averaged across detected events during the spontaneous activity period (top) and closed-loop control period (bottom) (n = 6 trigger neurons, black trace; each trigger neuron was associated with a different group of 5 target neurons; grey trace).
(e) Experimental strategy: dynamic interrogation of ensembles with multiple trigger neuron and multiple targets. Multiple neurons in the field of view were selected as triggers and associated with a unique group of target neurons. The associated group of target neurons were photostimulated (same photostimulation settings as in a) when an event was detected in the corresponding trigger neuron.
(f) A field of view in layer 2/3 of mouse somatosensory cortex (scale bar, 50 μm) in an awake mouse. Three trigger neurons (numbered) were selected to drive photostimulation of three different groups of 5 pre-defined target neurons (indicated by lines from triggers to targets; representative example of 3 independent experiments with similar results).
(g) Calcium transients in which target neurons (gray traces) were photostimulated (red vertical lines show when the target group was stimulated; grey vertical lines show when the other target group(s) was stimulated) when their corresponding trigger neurons crossed an activity threshold (black traces).
(h) Pearson’s correlation matrices of the calcium transients recorded from the trigger neurons and target neurons as plotted in (g), during the spontaneous period (top) and closed-loop period (bottom). Each color bar covers the rows (or columns) that corresponds to neurons in the same trigger-targets group, with arrows pointing at the trigger neurons (n = 3 trigger neurons and 15 target neurons in this example).
(i) Closed-loop conditioning: a group of 10 target cells (red contours) were activated when an event was detected in a trigger cell (black contour) in layer 2/3 of somatosensory cortex in an awake mouse (scale bar, 50 μm, 30 mW on sample). Left: spatial map of all detected neurons in the field of view. Color shows the amplitude of each neuron’s calcium transients averaged in a 500 ms window after the onset of photostimulation (stimulation duration 12 ~ 25 × 10 ms spirals at 100 Hz; 30 mW per cell, Fidelity laser or 4 mW per cell, Satsuma laser). Right: average calcium transient of the trigger cell (black) and the target cells (grey) after photostimulation (red vertical line. Center value is mean; shaded area shows standard deviation).
(j) Example inferred spike traces from calcium imaging of the trigger cell (top row) and the target cells (bottom rows) before and after closed-loop photostimulation (30 minutes conditioning in each experiment).
(k) Open-loop conditioning: a group of 10 target-cells (red contours) were randomly activated during periods when no events were detected in a trigger cell (black contour) in layer 2/3 of somatosensory cortex in an awake mouse (scale bar, 50 μm, 30 mW on sample). Left: spatial map of all detected neurons in the field of view (colored in the same fashion as (i)). Right: average calcium transient of the trigger cell (black) and the target cells (grey) after photostimulation (red vertical line. Center value is mean; shaded area shows standard deviation).
(l) Same as (j) for open-loop photostimulation.
(m) The inferred spike rate of the target cells increased significantly after closed-loop photostimulation (red, **** P = 1.3 × 10⁻¹⁰, Wilcoxon signed-rank test (two-sided), n = 57 cells in 6 animals); no significant change in inferred spike rate is observed in the open-loop photostimulation targets (grey, n.s. (not significant) P = 0.11, Wilcoxon signed-rank test, n = 56 cells in 6 animals). The change in inferred spike rate after closed-loop photostimulation is significantly higher than the change after open-loop photostimulation (**** P = 3.5 × 10⁻⁸, Wilcoxon rank sum test (two-sided); center values are mean; error bars show standard error; all statistical tests in the panel were performed on the average inferred spike rates of the whole pre- or post-conditioning recording).
(n) Schematic showing potential loci of plasticity: closed-loop photostimulation may have induced changes in the connections from the upstream neurons driving the trigger and target neurons to the target neurons, the direct and indirect connections from trigger to target neurons, and between the targets themselves, in addition to possible changes in intrinsic excitability (yellow).

