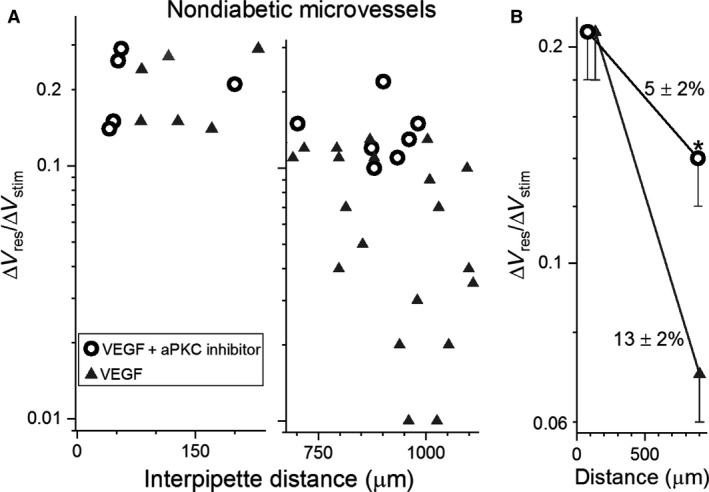
Figure 5.

Effect of an inhibitor of aPKC on the VEGF‐induced boost in voltage decay in nondiabetic microvessels. (A) ΔV responder/ΔV stimulator ratios measured at short (left panel) and long (right panel) interpipette distances in nondiabetic microvessels exposed for >2.5 h to 100 ng/mL VEGF in the absence (data from Fig. 3A) or presence of the specific aPKC inhibitor (100 nmol/L) for > 1 h. (B) means of the data in A plotted at the average interpipette distances. Rates of voltage decay per 100 μm are shown. *P = 0.0117.
