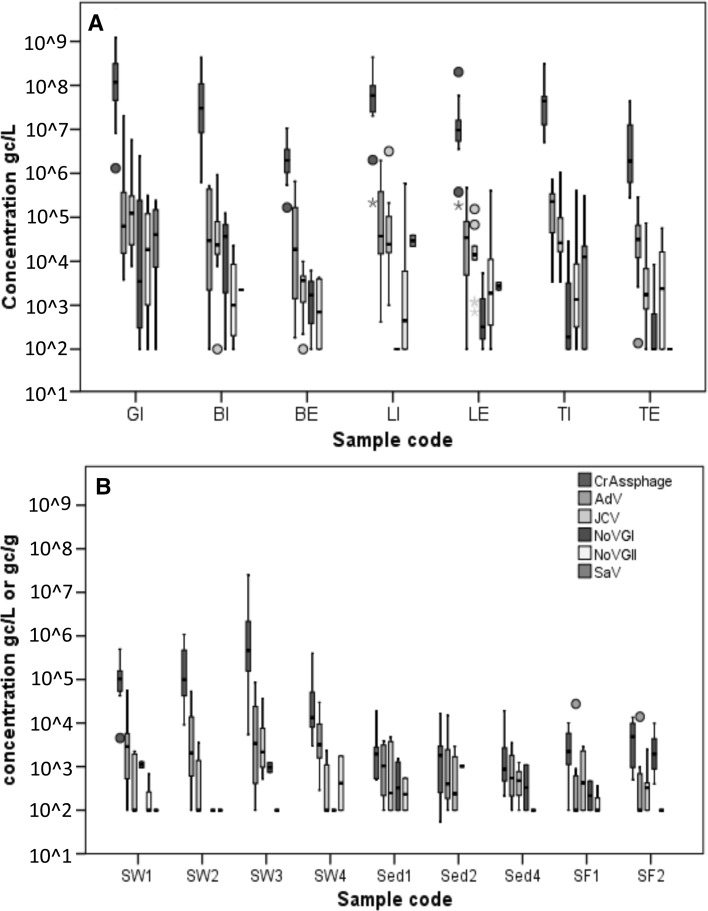
Fig. 1.
Box plot showing the median concentration (min–max) of crAssphage (blue), human adenovirus (AdV; green), JC polyomavirus (JCV; gray) norovirus GI (NoVGI; purple) and GII (NoVGII, yellow) and sapovirus (SaV; red) determined in (A) wastewater influent (GI, BI, LI and TI) and effluent (BE, LE, TE) and in (B) surface water (SW1-4), sediment (Sed1, 2, 4) and mussel (SF1, 2). Sample concentration below the limit of quantification was considered 100 gc/l or gc/g. Circles: outliers, starts extreme outliers

