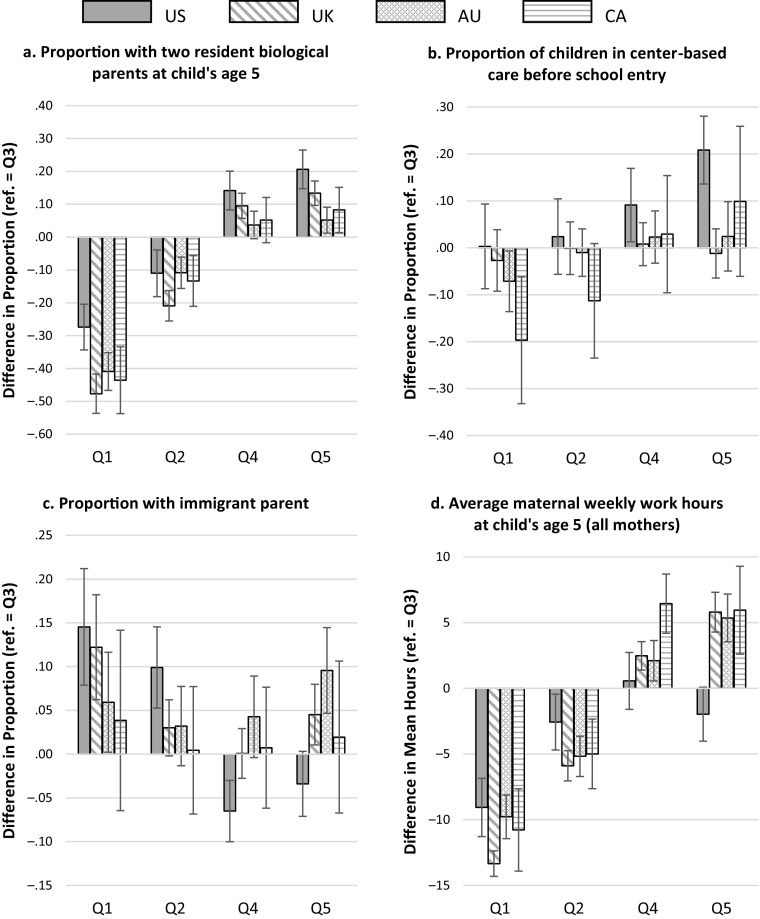
Fig. 2.
Within-country gaps in family characteristics (reference category = Q3). Each panel plots the gaps in a different variable. Error bars are 95 % confidence intervals. Q1 to Q5 refer to income groups defined by the quintile boundaries of the U.S. distribution from lowest to highest; that is, Q1 is the group with income less than $27,000 and Q5 is the group with income greater than $96,000. Gaps are the differences between the mean or proportion in the group and the middle (Q3) group (families with incomes of $44,000–$65,000). Estimates are calculated from the underlying microdata separately for each country. See Tables 1 and 2 for details of the source samples.

