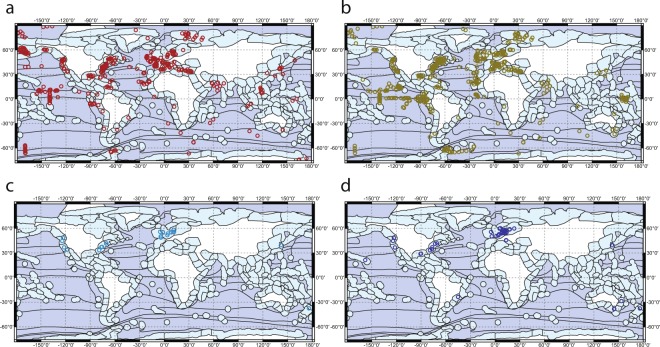
Fig. 1.
The geographical location of reported bioturbation parameter values. (a) Db, the biodiffusion coefficient, (b) L, the sediment mixing depth, (c) q1, the ventilation rate for named macro-invertebrate species or for mixed communities taken during active bouts of ventilation and (d) q2, the ventilation rate for named macro-invertebrate species or for mixed communities estimated over extended periods of time. Data points may represent multiple observations at that locality. The boundaries of ecoregion domains and divisions33 (dark blue shading) and provinces34 (light blue shading) are indicated.

