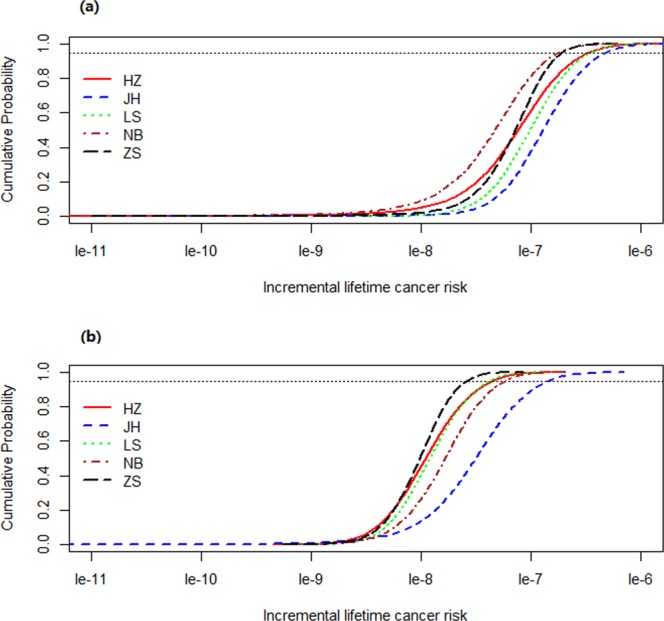
Figure 3.

Cumulative probability distribution of incremental lifetime cancer risk induced by atmospheric PAHs via inhalation from PM2.5 for different population groups in 5 selected cities of Zhejiang Province: (a) Adults, (b) Children. The figure was generated by R 64 3.3.1 with function plot: A Language and Environment for Statistical Computing, author: R Core Team, R Foundation for Statistical Computing, Vienna, Austria (https://www.R-project.org).
