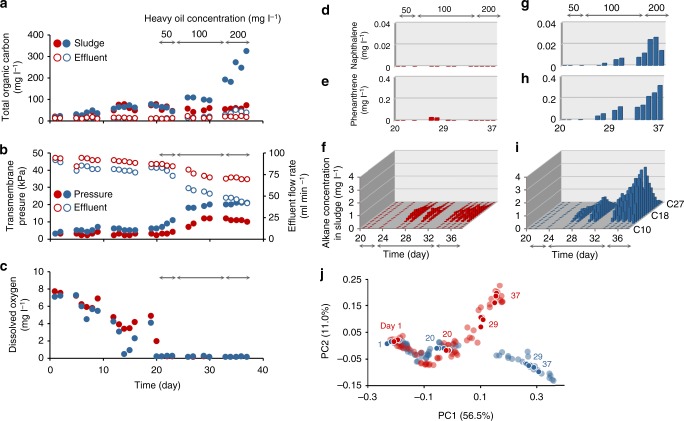
Fig. 2.
Dynamics of reactor performance parameters and microbial community structures in the two reactors. a Total organic carbon; b transmembrane pressure and effluent flow rate; c concentration of dissolved oxygen in sludge; and d–i concentrations of the following hydrocarbons in sludge: d, g naphthalene; e, h phenanthrene; f, i, alkane. Displayed hydrocarbon concentrations are mean values of duplicate measurements. j Scatter plot of principle-coordinate-analysis of 16S rRNA gene sequences conducted on the basis of the weighted UniFrac distance, generated by QIIME32. Distances between points denote similarity of microbial community structure, with smaller distances indicating greater similarity. Foreground points denote days 1, 20, 29, and 37, which correspond to start of operation and three time-points of RNA-seq analyses, respectively. For all panels, red and blue symbols or bars indicate reactors 1 and 2, respectively

