Fig. 3.
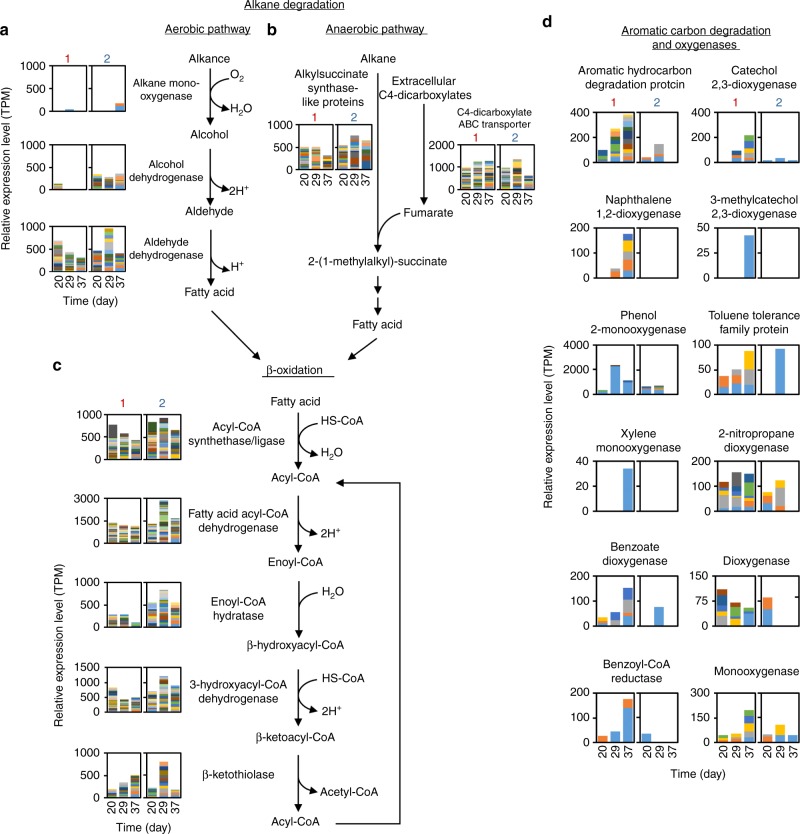
Relative gene expression levels for hydrocarbon and fatty acid degradation pathways. a Aerobic alkane degradation. b Anaerobic alkane oxidation. c Fatty acid degradation (beta-oxidation). d Aromatic hydrocarbon-degrading enzymes and oxygenases. For all graphs, left and right panels correspond to the relative expression levels of the genes in reactors 1 and 2, respectively. Color-coded fractions indicate relative expression levels of individual transcript assemblies

