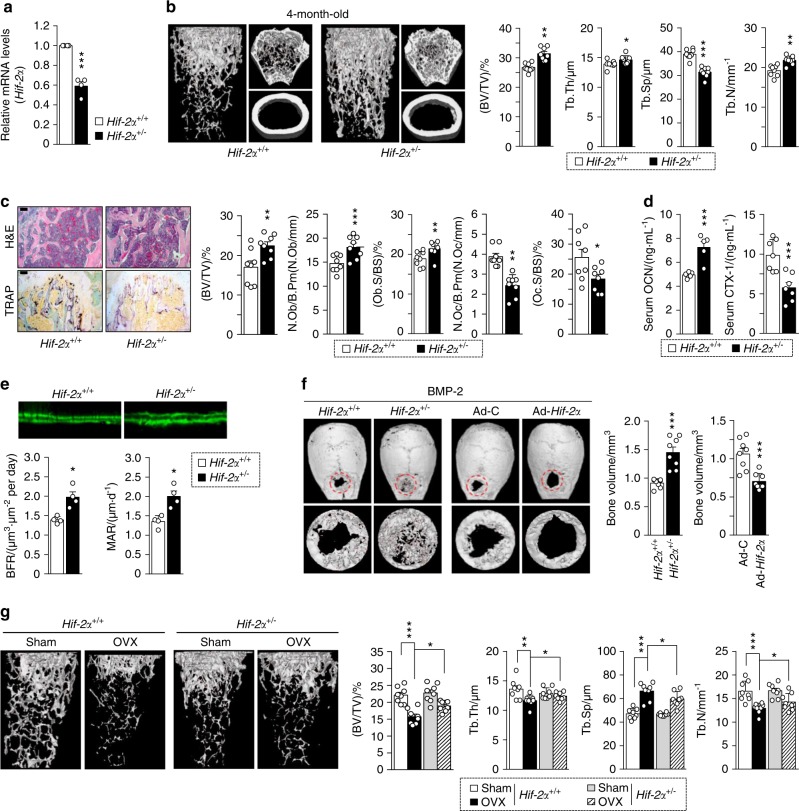
Fig. 1.
Heterozygous Hif-2α KO mice show increased bone mass. a–e Analysis of femoral trabecular or calvarial bones from 4-month-old Hif-2α+/− and WT mice. mRNA levels of Hif-2α in femoral bone from WT (Hif-2α+/+) and Hif-2α+/− mice (n = 4; a). Representative images of µCT reconstructions of femoral trabecular and cortical bones (b) and H&E and TRAP staining of trabecular bones (scale bar: 100 μm; c). Bone volume per tissue volume (BV/TV), trabecular bone thickness (Tb.Th), trabecular separation (Tb.Sp), and trabecular number (Tb.N) were analyzed based on the µCT measurements (n = 8; b). BV/TV, the number of osteoblastic cells per bone perimeter (N.Ob/B.Pm), the osteoblast surface normalized by bone surface (Ob.S/BS), the number of osteoclastic cells per bone perimeter (N.Oc/B.Pm), and the osteoclast surface normalized by bone surface (Oc.S/BS) were assessed by bone histomorphometric analyses of the metaphyseal regions of femurs (n = 8; c). ELISA-based measurement of the serum concentrations of OCN (n = 5) and CTX-1 (n = 7) (d). The bone forming rate (BFR) and mineral apposition rate (MAR) were analyzed from measurements obtained using calcein double labeling of femurs (n = 4; e). f Representative µCT images and measurements of bone volume of calvarial defect models generated in Hif-2α+/− and WT mice and in C57BL/6 mice infected with Ad-Hif-2α or Ad-control (Ad-C) (n = 8). g Representative images of µCT reconstructions of femoral trabecular bones are shown, and quantitative µCT analysis was used to measure the BV/TV, Tb.Th, Tb.Sp, and Tb.N of the femoral bones from OVX- or sham-operated mice (n = 8). Values are presented as the mean ± SEM (*P < 0.05, **P < 0.01, and ***P < 0.005). The effects of OVX and genetic deletion of Hif-2α as well as their interaction in mice were analyzed by two-way ANOVA (g BV/TV: interaction = 0.048 7, OVX < 0.000 1, genetic deletion of Hif-2α = 0.024 5)

