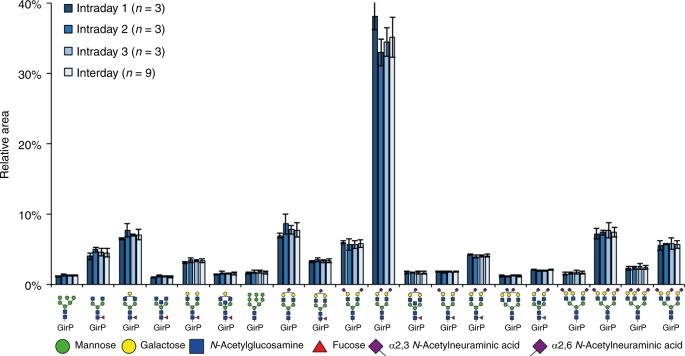
Fig. 4.
Inter- and intraday repeatability of the TPNG analysis by CE-ESI-MS. The released N-glycans were analysed after sialic acid derivatization and reducing end labelling with GirP. The relative abundances of the 20 most abundant glycoforms are displayed (for a complete overview, see Supplementary Fig. 7), showing a median RSD of 6.8% within technical replicates form the same day and a median RSD of 9.4% over 3 days. To enable automated peak integration, the electropherograms were aligned prior to data extraction32. The relative glycan profiles and their variation were similar before and after alignment (Supplementary Figs. 10 and 11). Blue square: N-acetylglucosamine, green circle: mannose, yellow circle: galactose, red triangle: fucose, right pointing pink diamond: α2,6-linked N-acetylneuraminic acid, left pointing pink diamond: α2,3-linked N-acetylneuraminic acid, GirP: Girard’s reagent P label. Error bars represent the standard deviation (intraday n = 3, interday n = 9, independent technical experiments). Source data are provided as a Source Data file

