Fig. 1.
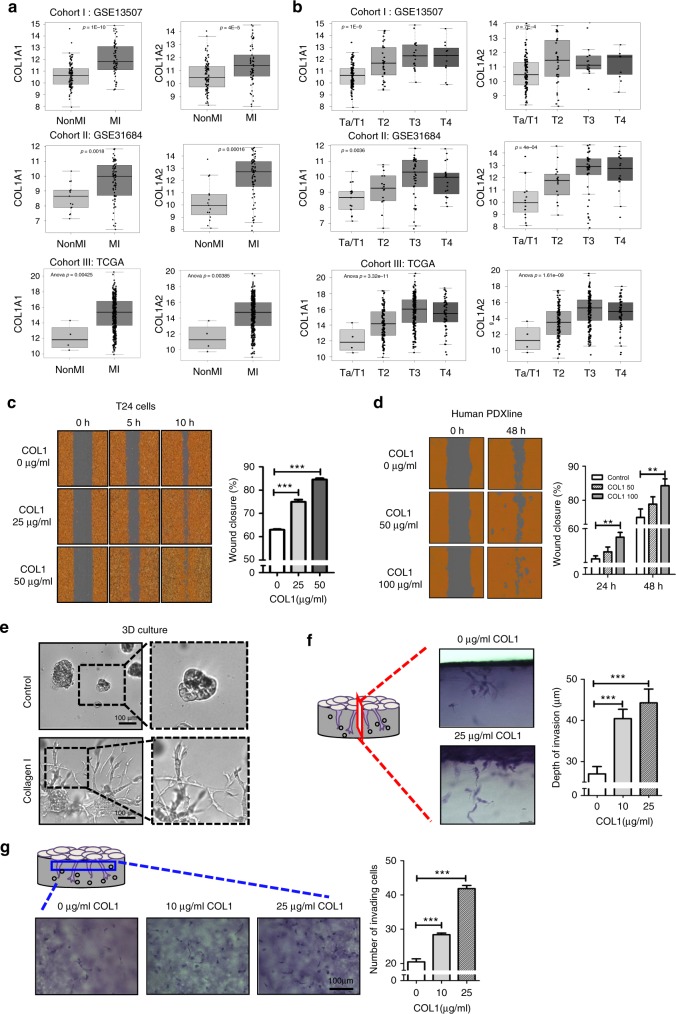
Collagen I expression correlates with increasing tumor stage and functionally enhances local invasion. a Comparative analysis of collagen I gene expression (COL1A1 and COL1A2) with non-muscle invasive and muscle-invasive bladder cancer status in three different human bladder cancer patient cohorts (cohort I: kim, n = 16520, cohort II: Riester, n = 9321, cohort III: TCGA n = 37622). b Correlation of COL1A1 and COL1A2 genes expression with clinical tumor staging (Bladder cancer T staging: pathological evaluation of invasion) in cohorts from a. c Dose-dependent treatment of exogenous collagen I (0, 25, and 50 μg ml−1) and its effects on T24 cell migration. Left panel: Representative images of wound closure at 0, 5, and 10 h under collagen I treatment. Right panel: Quantification of collagen I-induced percent migration at 10 h post-wound induction relative to 0 h. d Dose-dependent treatment of collagen I (50 and 100 μg ml−1) and its effects on a patient-derived xenograft (PDX) culture cell migration. Left panel: Representative images of wound closure at 0 and 48 h of collagen I treatment. Right panel: Quantification of collagen I-induced percent migration at 24 and 48 h post-wound induction relative to 0 h. e Representative images of T24 cancer cells cultured in a three-dimensional (3D) matrigel matrix in the absence (top panel, control) or presence (bottom panel) of collagen I (0.25 mg ml−1). f, g The 3D-invasive capacity of T24 cells in the presence or absence of collagen I treatment (0, 10 or 25 μg ml−1) for 48 h. Representative photos of perpendicular (f, left panel) and horizontal sections (g, left panel) of tumor cells invading through the matrix. The distance and the corresponding number of invading cells from the monolayer into the matrix were quantified as presented in right panel of graft f, g, respectively. Statistical analysis: a, b Analysis of Variance test (ANOVA); c–g, a two-tailed, unpaired student’s t-test. Error bar: mean ± SEM, n = 3 independent experiments. **p < 0.01, ***p < 0.005

