Fig. 4.
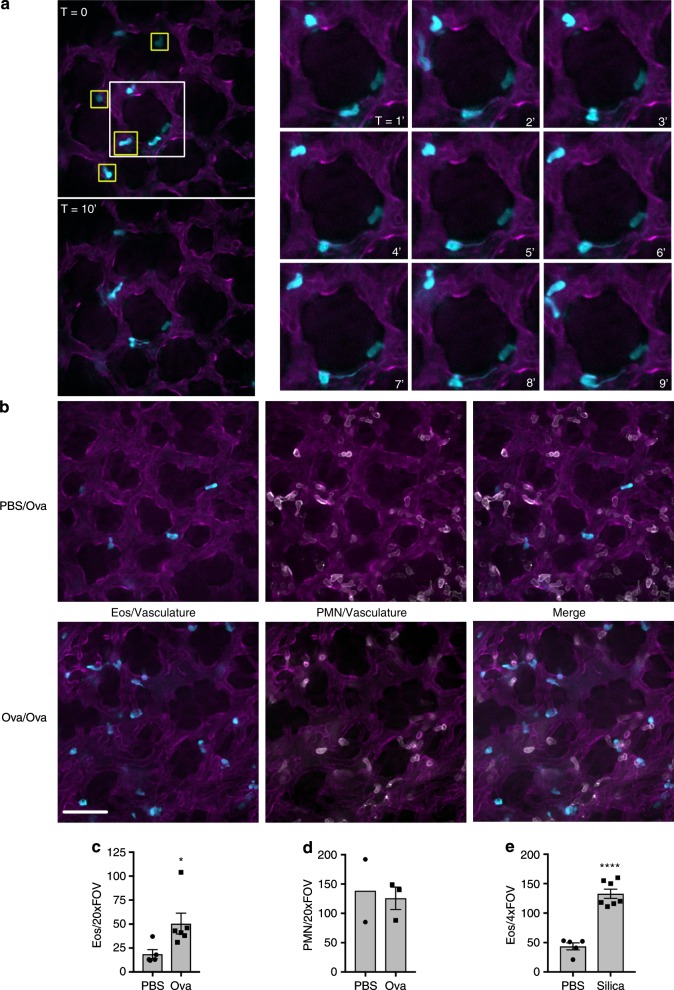
Intravital imaging of the lung under homeostatic conditions and following ovalbumin sensitization and challenge. a eoCRE+/−/tdTomato+/− mice were anesthetized and prepared for lung intravital microscopy without any stimulation as described in the “Methods.” Eosinophils express tdTomato (pseudo-colored cyan for consistency) and the vasculature is labeled with an anti-CD31 antibody conjugated to Alexa-488 (pseudo-colored magenta for consistency). Representative images were captured from video sequences to show eosinophils in the lung under baseline conditions that either interacted transiently with the vasculature (yellow boxes) or that patrolled the lung (time series on the right). Patrolling cells were intravascular as demonstrated by dual labeling with anti-CD45 (Supplementary Fig. 3). b–d eoCRE+/−/tdTomato+/− mice were sensitized with either phosphate-buffered saline (PBS) or ovalbumin (Ova) and then challenged with aerosolized Ova as described in the “Methods.” Forty-eight hours after the last Ova challenge, mice were anesthetized and prepared for intravital microscopy. Eosinophils express tdTomato (cyan), polymorphonuclear (PMN) cells were labeled with anti-Ly6G antibody conjugated to Alexa-647 (white), and the vasculature is labeled with an anti-CD31 antibody conjugated to Alexa-488 (magenta). Representative images captured from video sequences are shown in b and the quantified data for eosinophils and neutrophils (PMN) are shown in c, d, respectively. Data for eosinophils represent the mean ± SEM for n = 5 independent experiments (PBS) or n = 6 independent experiments (Ova). Data for neutrophils represent the mean and range of two experiments for PBS and mean ± SEM for n = 3 experiments for Ova. *p = 0.0341. e eoCRE+/−/tdTomato+/− mice were anesthetized and saline alone or saline with silica particles was instilled intranasally as described in the “Methods.” After 12 h, animals were anesthetized and prepared for intravital microscopy. Video sequences were captured and the number of eosinophils/×4 field of view was determined. The data shown in e represent mean ± SEM for n = 5 independent experiments (PBS) or n = 7 independent experiments (Silica). ****p < 0.0001. Scale bars are 50 μm

