Fig. 5.
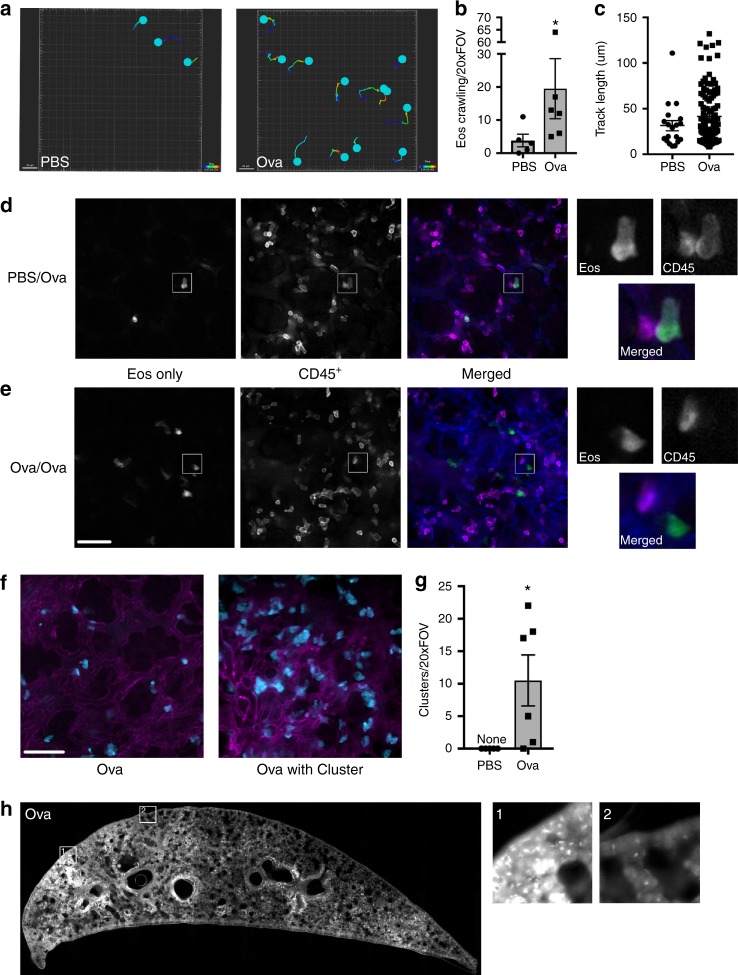
Eosinophil behavior and distribution in the lung following ovalbumin sensitization and challenge. EoCRE+/−/tdTomato+/− mice were injected with either phosphate-buffered saline (PBS) or ovalbumin (Ova) and then challenged with aerosolized Ova as described in the “Methods.” Forty-eight hours after the last Ova challenge, mice were prepared for intravital microscopy of the lung. a The migration tracks of eosinophils from either PBS/Ova (PBS) or Ova/Ova (Ova) animals are shown. The number of crawling eosinophils (b) and the distance traveled (c) were measured. Data in b are mean ± SEM and individual values from n = 5 independent experiments (PBS) or n = 6 independent experiments (Ova) (*p = 0.0173) and the data in c show the individual measurements of track length. d, e Prior to intravital imaging of eoCRE+/−/tdTomato+/− mice, animals were given an intravenous injection of anti-CD45 conjugated to Alexa-647. Images from individual channels are shown in grayscale. Merged images show eosinophils in green, intravascular leukocytes labeled with anti-CD45 antibody in magenta, and the vasculature in blue. Data represent three independent experiments. f Dispersed eosinophils or eosinophils in clusters are shown in f and the extent of clustering is quantified in g. Data in g represent the mean ± SEM of n = 5 independent experiments (PBS) or n = 6 independent experiments (Ova). *p = 0.0152. h Lungs from Ova/Ova eoCRE+/−/tdTomato+/− mice were fixed and imaged as described in “Methods.” Scale bars are 50 μm

