FIGURE 2.
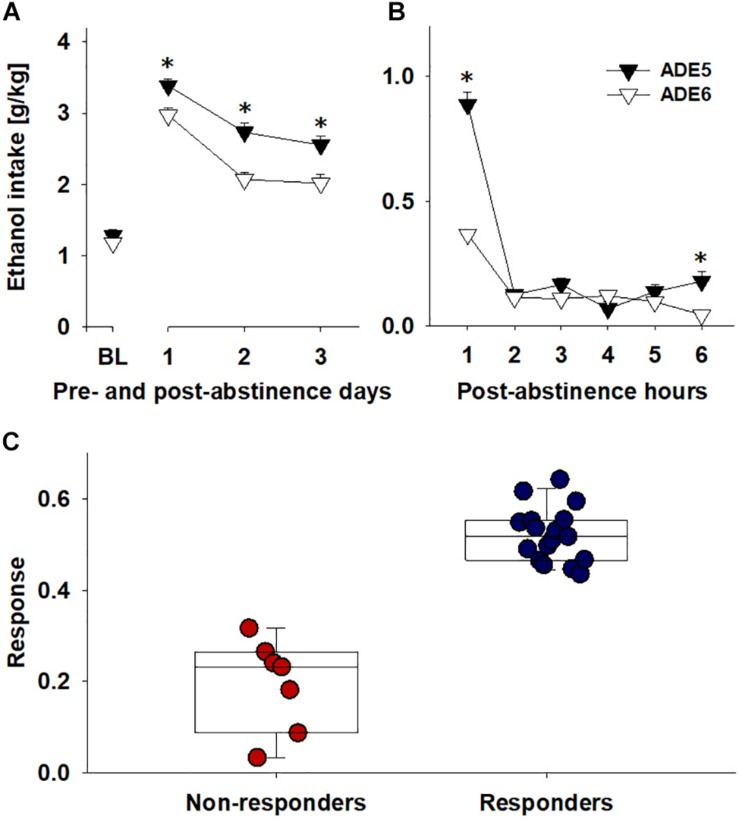
Comparing ADE5 and ADE6 for response to nalmefene: ethanol intake for (A) baseline and the first three post-abstinence days and (B) first 6 h post-abstinence. (C) To quantify response to nalmefene treatment, total alcohol consumption (intake of pure ethanol in g per kg of body weight in 6 post-abstinence hours) was compared across ADE5 and ADE6 to give a % alcohol consumption reduction score: Response = (ConsumptionADE5 – ConsumptionADE6)/ConsumptionADE5. Examination of the distribution of reduction of ethanol intake during the first 6 h allowed classification of rats into two groups, Responders (blue, rats above the mean response level, n = 17) and Non-responders (red, rats below the mean response level, n = 7). Data are presented as means ± S.E.M. *indicates significant difference from ADE6, p < 0.05.

