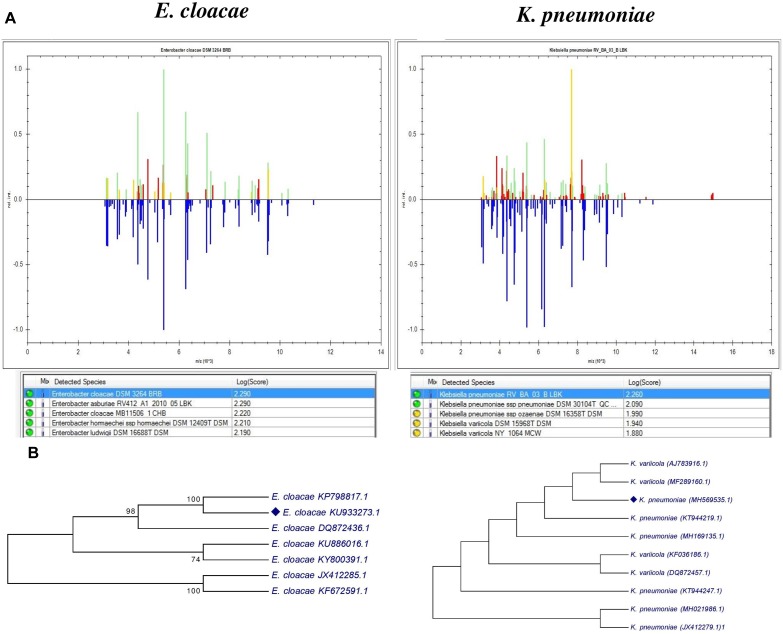
FIGURE 2.
Identification of bacterial endophytes, (A) Comparison of mass spectrum protein profiles of bacterial isolates with database of MALDI Biotyper Compass Explorer software version 4.1.60. Blue means the spectrum stored in the database used for pattern matching. Green indicates matched peaks, red mismatched peaks, and yellow intermediate peaks (B) phylogenetic analysis of 16srRNA sequences of the two endophytic strains and their comparison with another reported banana endophytic strains. The analysis was conducted with MEGA7 using neighbor-joining method.

