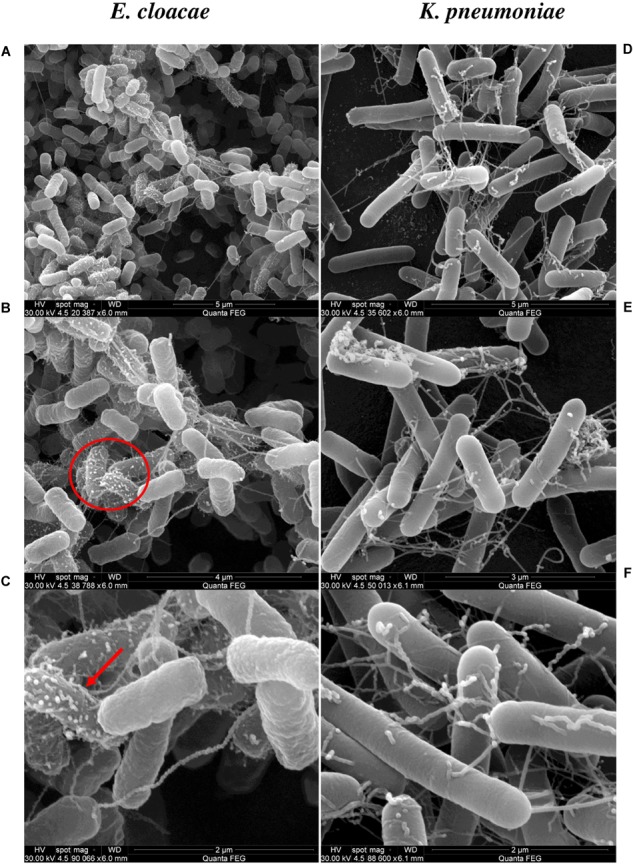
FIGURE 3.

SEM analysis of E. cloacae (Ec) and K. pneumoniae (Kp) incubated by 18 h. The left and right panels show SEM of Ec and Kp cells, respectively. (A,B) Surface of E. cloacae cells with lateral flagella, pili. Red circle in (B) indicates the area of the next magnification. (C) The red arrow indicates formation of outer membrane vesicles (OMV) on the surface of Ec cells, which is not present in Kp all over the bacterial cell at 2 μm. In (D–F) K. pneumoniae have a larger cell of 0.3–1.0 μm wide X 0.6–6.0 μm lengths, lateral flagella and pili. The bar scales are shown at the lower right of each microphotograph.
