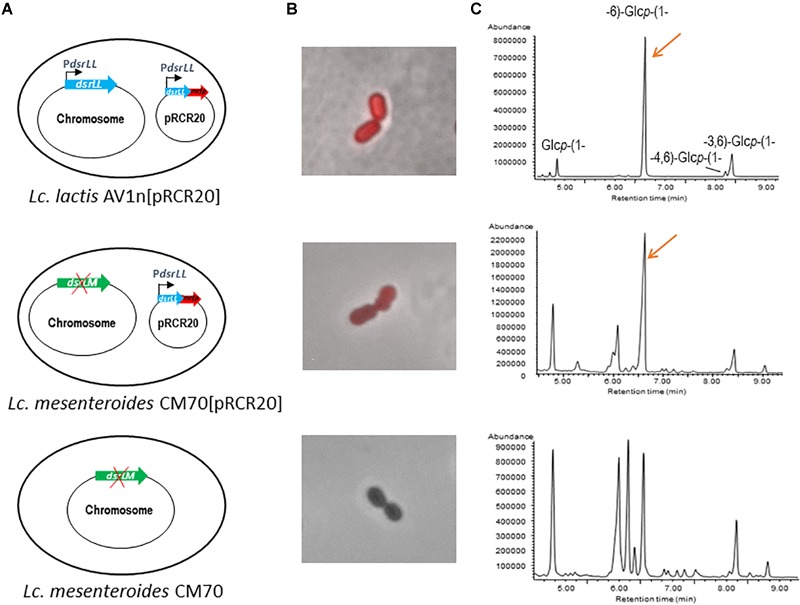
FIGURE 2.

Analysis of influence of over-expression of dsrLL gene in Lc. lactis AV1n and Lc. mesenteroides. (A) Diagram of the bacterial genome. (B) Overlay of fluorescence and phase contrast images of the analyzed LAB. (C) Chromatograms obtained by the methylation analyses of the bacterial EPS.
