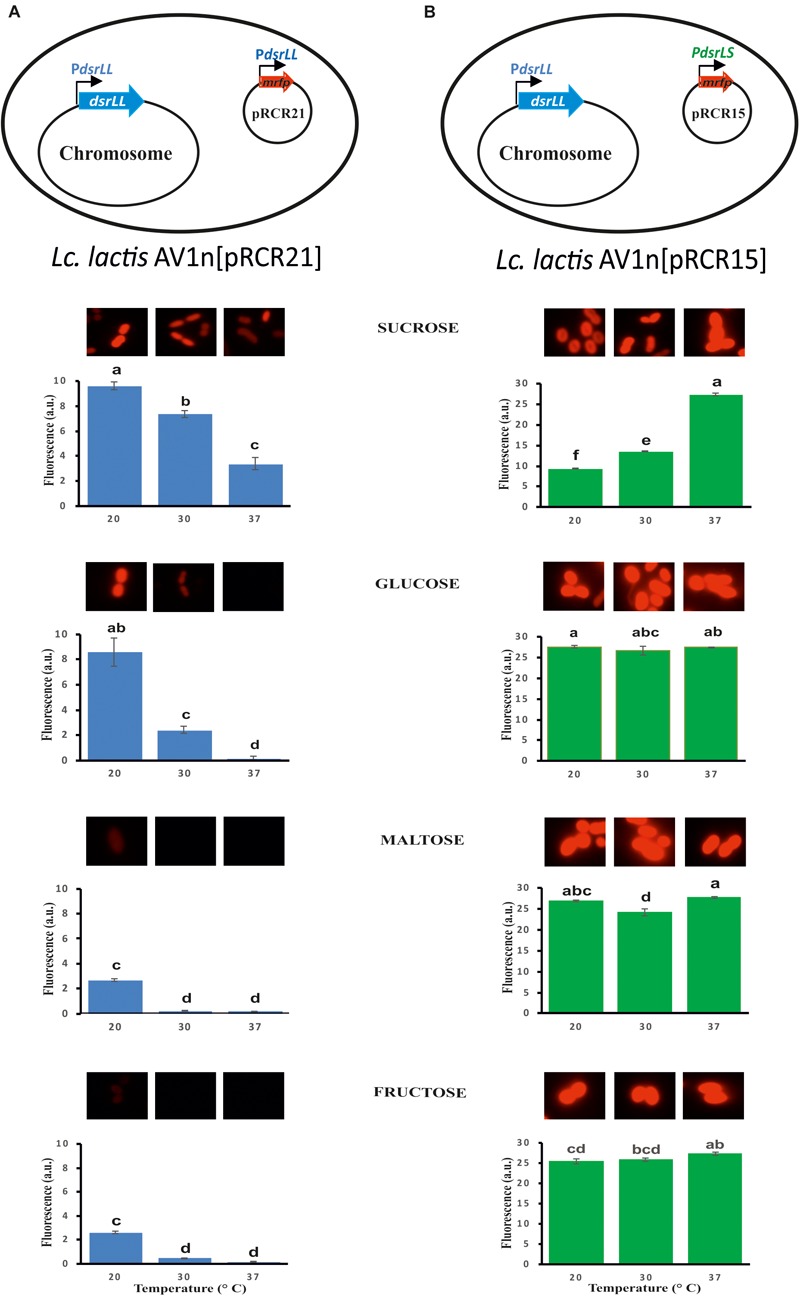
FIGURE 5.

Fluorescent detection of the expression of mrfp from the PdsrLL (A) or PdsrLS (B) promoter in the indicated LAB. Bacterial cultures grown in MRSG, MRSS, MRSM and MRSF at 20, 30, and 37°C were analyzed at the middle of the exponential phase by fluorescent microscopy. The specific fluorescence is depicted, and it was calculated as the ratio of the detected fluorescence (5×) and the bacterial biomass estimated from the A600 nm of the culture. The ANOVA statistical analysis of the results is depicted. A p ≤ 0.05 was considered significant. Mean pairwise comparisons were computed with a Tukey’s test (α = 0.05). Means with the same letter were not significantly different.
