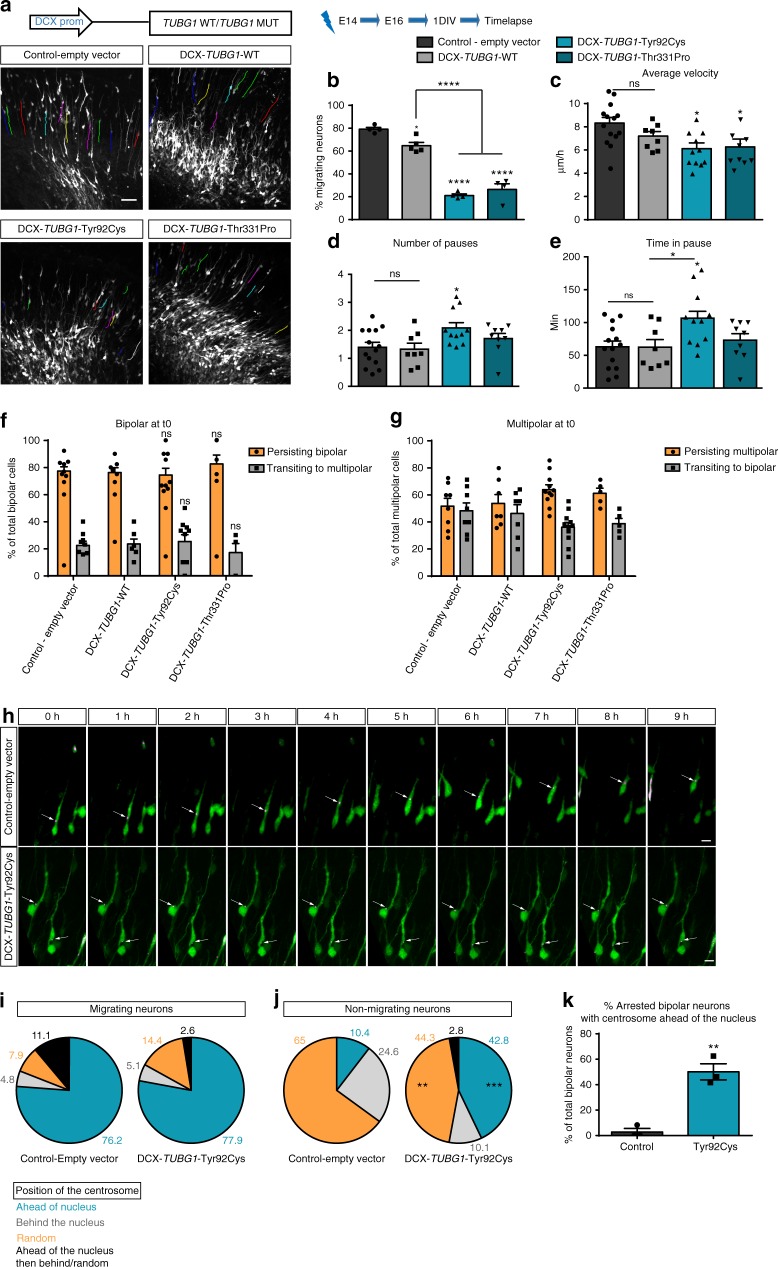
Fig. 3.
Real-time recordings of migrating cortical neurons. a Locomotory paths (colored lines) of electroporated neurons recorded during time-lapse imaging. Scale bar 50 µm. b–e Percentage of migrating neurons (n = 4 independent time-lapse experiments per group) (b), average migration velocity (n ≥ 8 independent time-lapse experiments per group) (c), average number of pauses (n ≥ 8 independent time-lapse experiments per group) (d), and total time spent in pause (n ≥ 8 independent time-lapse experiments per group) (e) during the 10 h of recording. Data were analyzed with One-way ANOVA with Tukey’s post hoc test, *p < 0.05, **p < 0.01, ****p < 0.0001 compared to control-empty vector; ****p < 0.0001 compared to DCX-TUBG1-WT. f Percentage of electroporated bipolar cells persisting bipolar or transitioning to multipolar morphology in 10 h recordings (n = 4 independent experiments per group). Comparisons were made to control-empty vector and TUBG1 wild type overexpression. g Percentage of electroporated multipolar cells persisting multipolar or transitioning to bipolar morphology in 10 h recordings (n = 5 independent experiments per group). Comparisons were made to control-empty vector and TUBG1 wild type overexpression, Two-way ANOVA with Tukey’s multiple comparisons test. h–k. Centrosome positioning in migrating and non-migrating neurons. h Sequences of images during time-lapse recording of bipolar neurons co-electroporated with GFP (green) and the centrosomal marker PACT-mKO1 (magenta) together with either control or TUBG1-Tyr92Cys. Centrosome is indicated by white arrows. Scale bar 10 µm. Quantification of centrosome positioning in migrating (i) and non-migrating (j) neurons. Neurons were divided in four different categories according the position of their centrosome during the time-lapse recording: ahead of the nucleus, behind the nucleus, random relative to the nucleus, ahead of the nucleus in the beginning of the recording and then behind it or random. Data are represented as pie charts for either migrating or non-migrating neurons. Two-way ANOVA with Sidak’s multiple comparisons test, **p < 0.01, ***p < 0.001. k Percentage of arrested electroporated bipolar neurons with the centrosome ahead of nucleus, n ≥ 3 independent time-lapse experiments per group, Unpaired t-test, p = 0.0024, compared to control-empty vector. Histograms represent mean ± s.e.m. Source data are provided in the Source Data file

