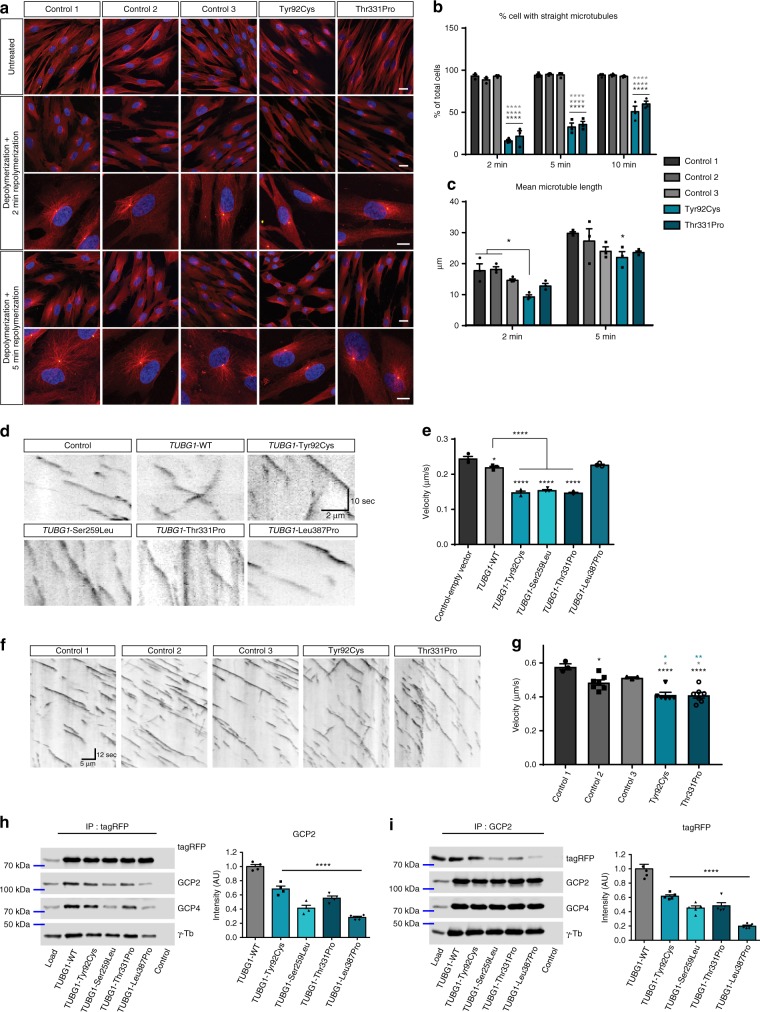
Fig. 4.
TUBG1 mutations alter microtubule dynamics and γ-tubulin complexes a Microtubules (red) and TUBG1 (yellow) staining in subject-derived fibroblasts, without treatment and after microtubule depolymerization and subsequent repolymerization. Scale bars 20 µm (upper panels) and 10 µm (lower panels). b, c Quantification of the percentage of cells presenting with straight and organized microtubules (b) and microtubule mean length (c), Two-way ANOVA with Tukey’s multiple comparisons test, *p < 0.05, **** < 0.0001, compared to controls. d, e Microtubule dynamics in HeLa cells transfected with EB3 and different TUBG1 constructs. d Kymographs show EB3 trajectories in time (y, sec) and space (x, µm). Scale bar Y = 10 s, X = 2 µm. e Histograms represent mean velocity of EB3 comets, n = 3 independent experiments, one-way ANOVA with Tukey’s multiple comparisons test, *p < 0.05, ****p < 0.0001 compared to control-empty vector or wild type overexpression. f, g Microtubule dynamics in subject-derived fibroblasts. f Representative Kymographs of dynamic EB3 comets in different controls and mutant fibroblasts. Kymographs are calibrated in time (y, sec) and space (x, µm). Scale bar Y = 12 s, X = 10 µm. g Quantification of EB3 mean velocity, n ≥ 3 independent experiments, one-way ANOVA with Dennett’s post hoc test, *p < 0.05 compared to control fibroblasts. h, i. Immunoprecipitations in Neuro2a cells expressing tagRFP-tagged mouse Tubg1 (WT control) or its mutated variants. h Left: representative immunoblot after immunoprecipitation with anti-tagRFP antibody. Right: densitometric quantification of immunoblots stained against GCP2. Relative intensities of samples with mutated Tubg1-TagRFP normalized to WT control and to tagRFP levels in individual samples. i Left:representative immunoblot for immunoprecipitation with anti-GCP2 antibody. Right: densitometric quantification of immunoblots stained against RFP. Relative intensities of samples with mutated Tubg1-TagRFP normalized to WT control and to GCP2 levels in individual samples. Controls in left panels contained proteins A without antibodies incubated with the cell extracts, n = 5 independent experiments, one-way ANOVA with Bonferroni’s multiple comparisons test, ****p < 0.0001. All data are presented as mean ± s.e.m. Source data are provided in the Source Data file

