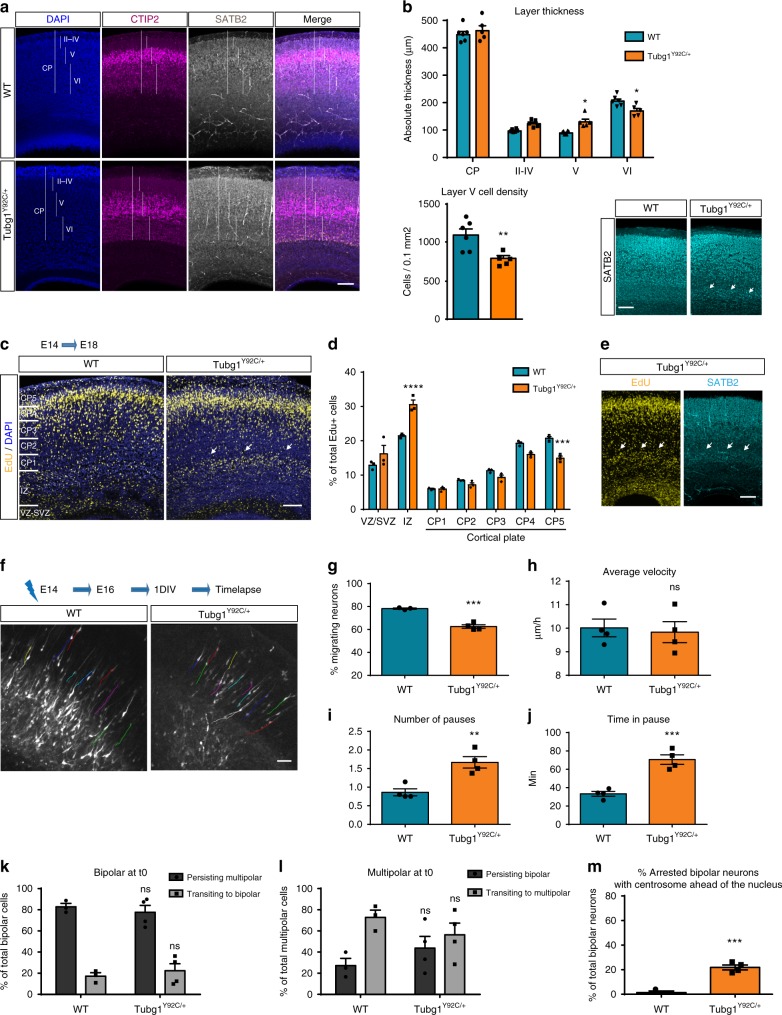
Fig. 5.
Tubg1Y92C/+ mice show abnormal cortical layering during development. a E18.5 cortices stained against SATB2 (gray), CTIP2 (magenta) and DAPI (blue). Vertical lines depict how cortical layers were considered for quantification, scale bar 50 µm. b Histograms represent the thickness of the cortical layers and CP (upper panel) and the cell density of layer V (lower panel). Data are from at least five embryos per condition, unpaired t-test, *p < 0.05, **p < 0.01. Right image shows heterotopic SATB2+ cells. Scale bar 50 µm. c EdU staining in the cortex. Cortical plate was divided into five equal bins from the intermediate zone to the marginal zone. White arrows show EdU-positives cells accumulation in the IZ. CP, cortical plate; IZ, intermediate zone; VZ/SVZ, ventricular zone/subventricular zone. Scale bar 100 µm. d Quantification of EdU-positive cells in the specified regions, n = 3 embryos per group, Two-way ANOVA with Tukey’s multiple comparisons test, *p < 0.05, ***p < 0.001. e Representative image of SATB2 staining in cortices of EdU injected Tubg1Y92C/+ mice. Scale bar 50 µm. f Locomotory paths (colored lines) of electroporated neurons during time-lapse imaging. Scale bar 50 µm. g Percentage migrating neurons, n = 3 WT and n = 4 Tubg1Y92C/+; h average migration velocity, i average number of pauses, and j. total time spent in pause, during the 10 h of recording, n = 4 independent experiments per group. Unpaired t-test, **p < 0.01, ***p < 0.001 compared to wild type mice. k Percentage electroporated bipolar cells persisting bipolar or transitioning to multipolar morphology in 10 h recordings (n = 3 WT, n = 4 Tubg1Y92C/+ independent experiments per group). l Percentage electroporated multipolar cells persisting multipolar or transitioning to bipolar morphology in 10 h recordings (n = 3 WT, n = 4 Tubg1Y92C/+, independent experiments per group). m Percentage of arrested electroporated bipolar neurons with the centrosome ahead of nucleus, n = 3 WT, n = 4 Tubg1Y92C/+ independent experiments per group. Unpaired t-test, ***p < 0.001 compared to wild type mice. All data are presented as mean ± s.e.m. Source data are provided in the Source Data file

